By Ma. Flordeliza P. Del Castillo1, Patricia Mae J. Paraiso1, May Celine T.M. Vicente1, Ma. Laurice P. Jamero2, Gemma T. Narisma3,4
1 Geomatics for Environment and Development, Manila Observatory
2 Resilience Collaboratory, Manila Observatory
3 Regional Climate Systems
4 Department of Physics, Ateneo de Manila University
Buod
Tatlong linggo matapos ang pagputok ng Bulkang Taal noong Enero 12, 2020, ibinaba ng PHIVOLCS ang Alert Level mula sa 4 patungo sa 3. Sa panahong ito, mahigit 400,000 katao ang naapektuhan. Sa pamamagitan ng mga larawang kinuha mula sa kalawakan at iba pang nakalap na impormasyon, naipakita ang mga epekto ng pagputok ng bulkan sa kapaligiran at sa komunidad. Gamit ang mga larawang kinuha mula sa kalawakan, napuna ang pagkatuyo ng lawa sa bunganga ng bulkan, ang mga abong ibinuga nito sa Pulo at sa mga karatig na probinsya, ang paglabo ng tubig sa Lawa ng Laguna, ang pagkasira ng mga palaisdaan, at ang pagbabago ng hubog ng lupa. Binalot ng abo ang mga bayan sa kanluran ng Lawa ng Taal. Ang mga bayang ito ay siya ring dating kinalalagyan ng mga bayang winasak ng pagputok ng Bulkang Taal noong 1911. Mayroon ding pagkakapareho sa mga lugar na nakaranas ng mga pagbitak ng lupa, sa mga lugar kung saan naitala ang mga bitak noong 1911.
Summary
Three weeks after Taal Volcano’s phreatic eruption on January 12, 2020, PHIVOLCS lowered the Alert Level from 4 to 3. At this time, more than 400,000 people have been affected. Satellite images complemented with reports from the ground revealed environmental changes and social impacts of the eruption. Satellite observations detected drying of Taal’s crater, ash deposits on the volcano island and the surrounding provinces, increased turbidity in Laguna Lake, damaged fish pens, and ground deformation. Ashfall covered towns north and west of Taal Lake. The towns west of Taal Lake greatly covered by ash in this recent eruption were the previous location of towns that the 1911 eruption obliterated. Similarities with the location of the fissures were observed after comparing maps of the 1911 eruption with the data of the 2020 eruption.
Overview of Impacts
- Overall, Taal Volcano’s eruption (Figure 1) damaged houses, blocked roads, interrupted the power and water supply, and halted airport services, and displaced more than 400,000 people (Figure 2).
- TROPOMI detected volcanic SO2 that may affect public health, especially of those in Southern Luzon suffering from respiratory diseases like asthma.
- Observed changes on Taal Volcano Island include drying up of the crater lake and change in land cover from vegetation and bare soil to ash.
- Turbidity Index (NDTI) showed no significant change in Taal Lake’s turbidity after the eruption but showed increased turbidity in Laguna Lake.
- Ground-based reports documented the drying up of Pansipit River.
- Satellite images have also detected damaged fish cages resulting in fish kills as an impact to aquatic life.
- Satellite images show ashfall covering the towns west and north of Taal Lake reaching as far as Sta. Rosa, Laguna.
- Earthquakes were recorded west of Taal Volcano. Radar images captured detected uplift southwest of Taal Lake and subsidence northeast of Taal Lake.
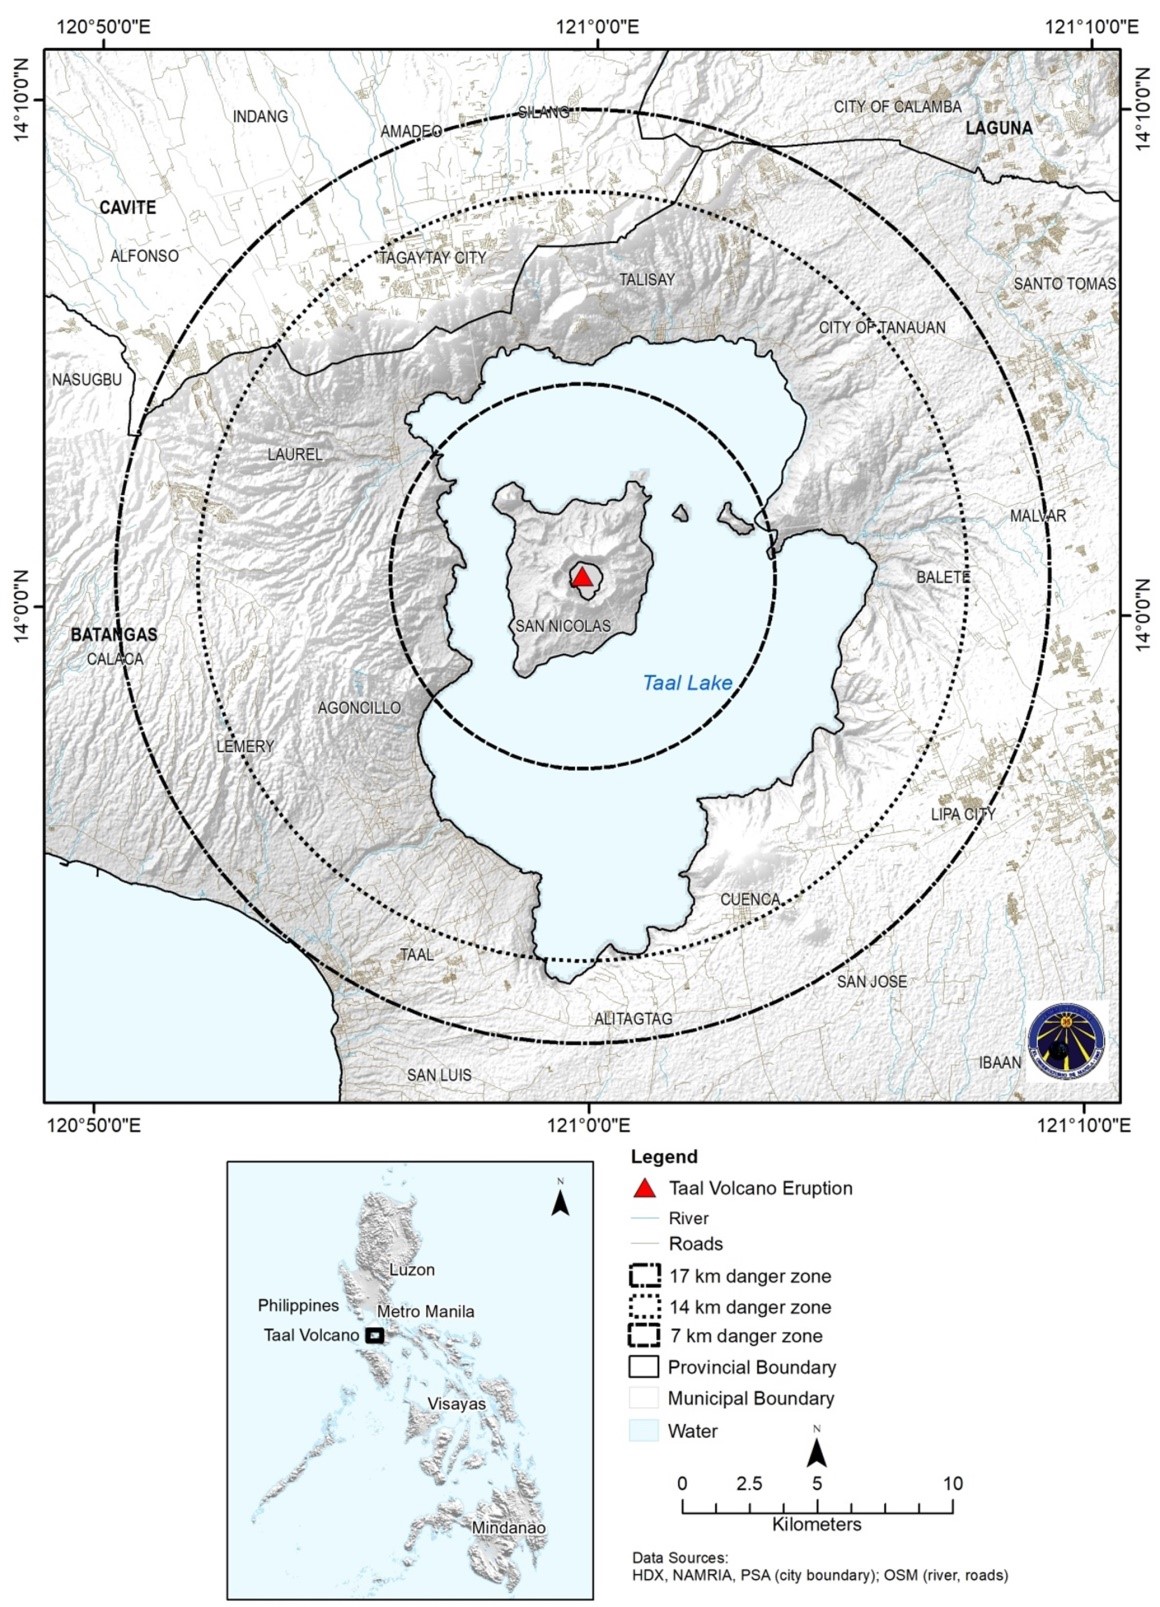
Figure 1: Location map of Taal Volcano
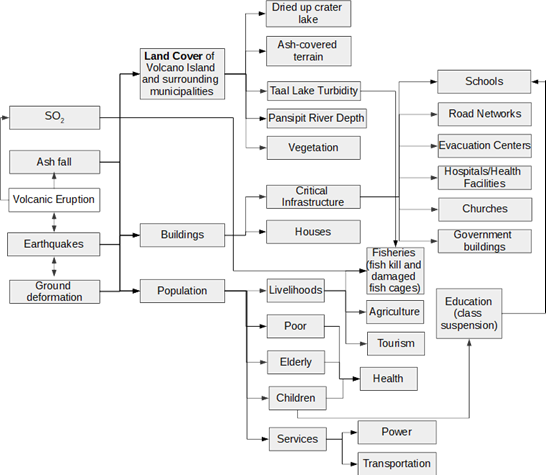
Figure 2. Impact chain
1. SO2 from Taal’s Volcanic Eruption
Taal Report Part I and II discussed the recent phreatic eruption’s impacts on air quality. Among the gases released after this eruption was sulfur dioxide (SO2). The Ozone Mapping Profiler Suite (OMPS) on the NOAA-NASA Suomi-NPP satellite detected the sulfur dioxide in the stratosphere on January 13, 2020. OMPS detected up to 40 Dobson Units (DU) of volcanic SO2 traces (see Figure 3). Starting its eruption on January 12 up to January 17, Taal released 6,500 tons of SO2 per day [1]. Emitted SO2 continued to drop in the past days. As of the writing of this report, SO2 emitted was 87 tonnes/day, according to PHIVOLCS [5].
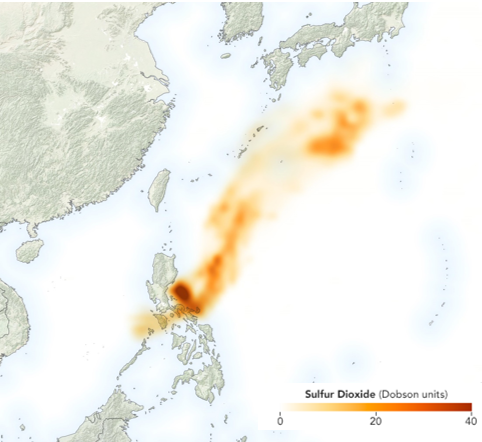
Figure 3. OMPS volcanic SO2 measurement in January 13, 2020 [20]
1.1 Impacts of SO2 on the Environment
Volcanic eruptions can release a substantial amount of SO2 to affect global temperature as in the case of Mt. Pinatubo. Mt. Pinatubo’s eruption in 1991 reportedly emitted more than 15 million tons of SO2 into the stratosphere that mixed with water to form tiny sulfate aerosols that reflect solar radiation into space reducing global temperature [5]. Compared with Mt. Pinatubo’s eruption, Taal’s eruption emitted significantly lower SO2 to affect global temperature [1]. However, if injected into the troposphere, SO2 can combine with water and air forming acid rain. Acid rain causes deforestation and can acidify water bodies. Acidic water can also harm aquatic life. Although the eruption came with light rainfall with volcanic lightning in the ash clouds, heavy and prolonged rainfall was not reported [2]. As of now, data on acid rain occurrence attributed to Taal’s eruption is not available.
1.2 Sulfur Dioxide’s Impacts on Health
Hardly visible, SO2 can be detected by its characteristic pungent odor. Exposure to SO2 can irritate a person’s eyes and respiratory system, the latter especially for people with respiratory diseases like asthma [5]. Elderly and children are also highly vulnerable to exposure to SO2 (Figure 4) [5][10]. Long-term exposure to volcanic SO2 can lead to fatigue, headaches, and allergies [7].
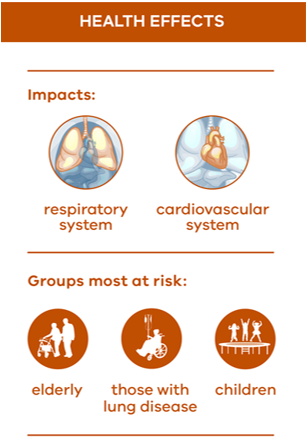
Figure 4. Effects of Sulfur Dioxide on health [19]
2. Changes on the Taal Volcano Island ‘Pulo’
2.1 Evolution of Taal’s Crater Lake
Figure 5 shows the drying up of Taal’s Crater Lake four days and fourteen days after its eruption on January 12, 2020. The crater rim generally stayed the same but the water inside the Crater Lake indicated by the black line in Figure 5 evaporated after the eruption leaving only some water at southwestern side inside the White Lake (in which broken lines) that was formed after the 1911 eruption. After 14 days, the water extended southwestwards beyond the crater floor (1911) and Crater lake (2019). A vent has also occurred at the southeast end of the Crater Lake.
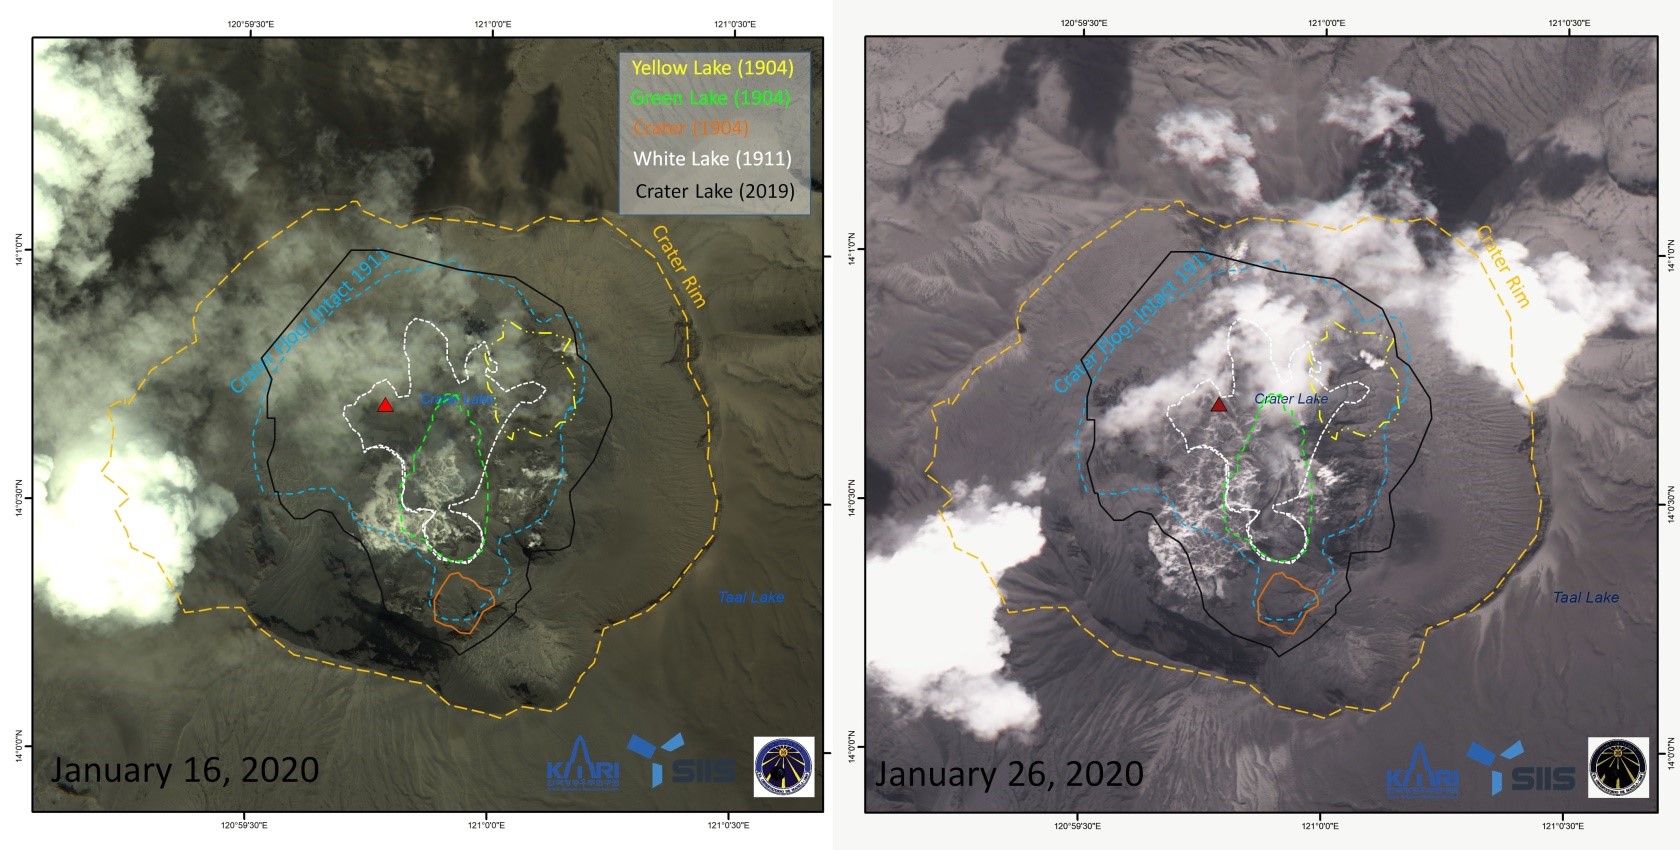
Figure 5. Changes in the main crater from January 16 to January 26, 2020 with the outlines of the Yellow Lake, Green Lake, and the active crater on 1904 as drawn by Sec. Worcester, the White Lake as drawn by Fr. Maso in 1911, and the Crater Lake from 2018 Landsat image. Image processed using KOMPSAT-3A data of Korea Aerospace Research Institute obtained from SI Imaging Services
Two weeks after the eruption, Sentinel-2 captured a true-color satellite image compared with the pre-eruption image taken by Landsat 8.
(Figure 6). The comparison confirmed the drying up of Crater Lake. A Finnish radar satellite image (Figure 7) showed that the crater lake did not completely disappear, as part of its Yellow Lake shown in Figure 3 maintained some water [7].
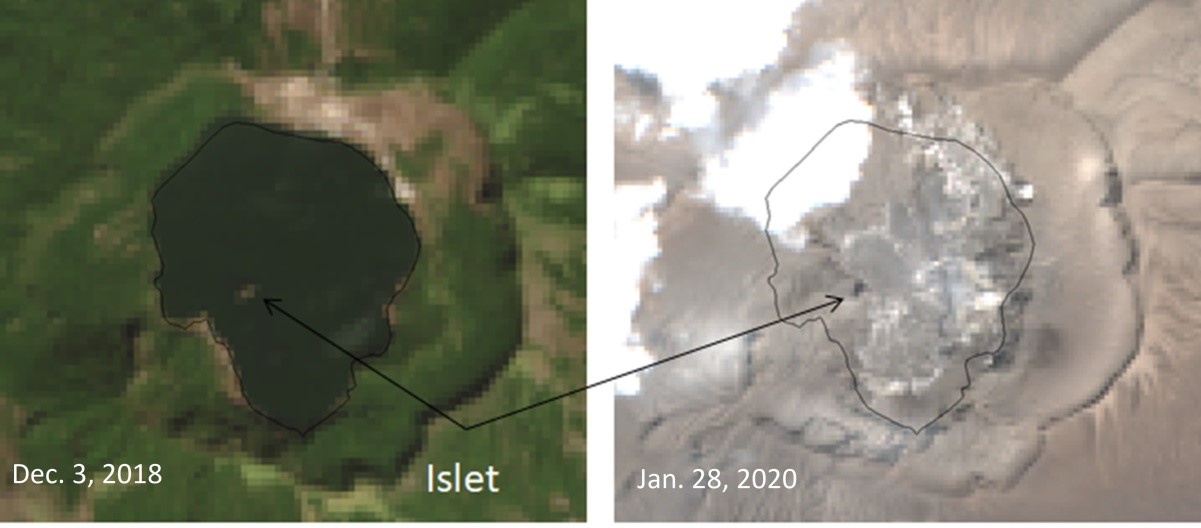
Figure 6. True-color Landsat 8 and Sentinel 2 images taken on December 3, 2018 and Jan. 28, 2020 show the small islet in the dried up crater lake (image processed using data from United States Geologic Survey via earthexplorer.usgs.org and European Space Agency via scihub.copernicus.eu).
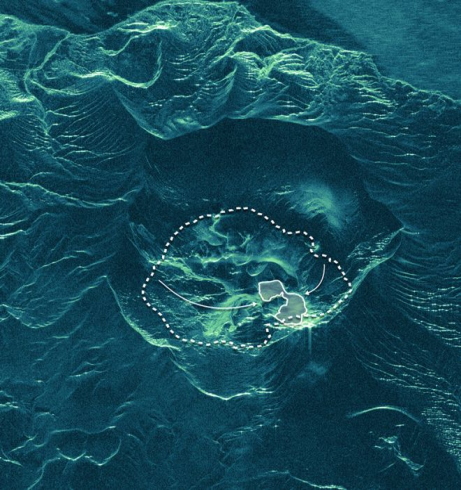
Figure 7. Radar image of Taal Volcano’s
Main Crater on January 16, 2020 [7].
The recent eruption continues to influence the transformation of Taal’s crater. Historical maps show that Taal Volcano’s crater changed after its previous eruption on January 30, 1911. Before its eruption in 1911, the crater had two main lakes, which Secretary Worcester, the interior secretary during the American occupation in the Philippines, called the Green and Yellow Lakes (see Figure 8). Worcester noted that the Red Lake temporarily appears when rainwater accumulates during the rainy season. After its eruption on January 30, 1911, the crater formed one larger lake called the White Lake. Eventually, water accumulated and filled the entire area within the dotted line which is the extent of the Crater Lake before its most recent eruption. In the case of Taal’s last eruption, the Yellow Lake was captured by the ICEYE Radar on January 16, 2020.
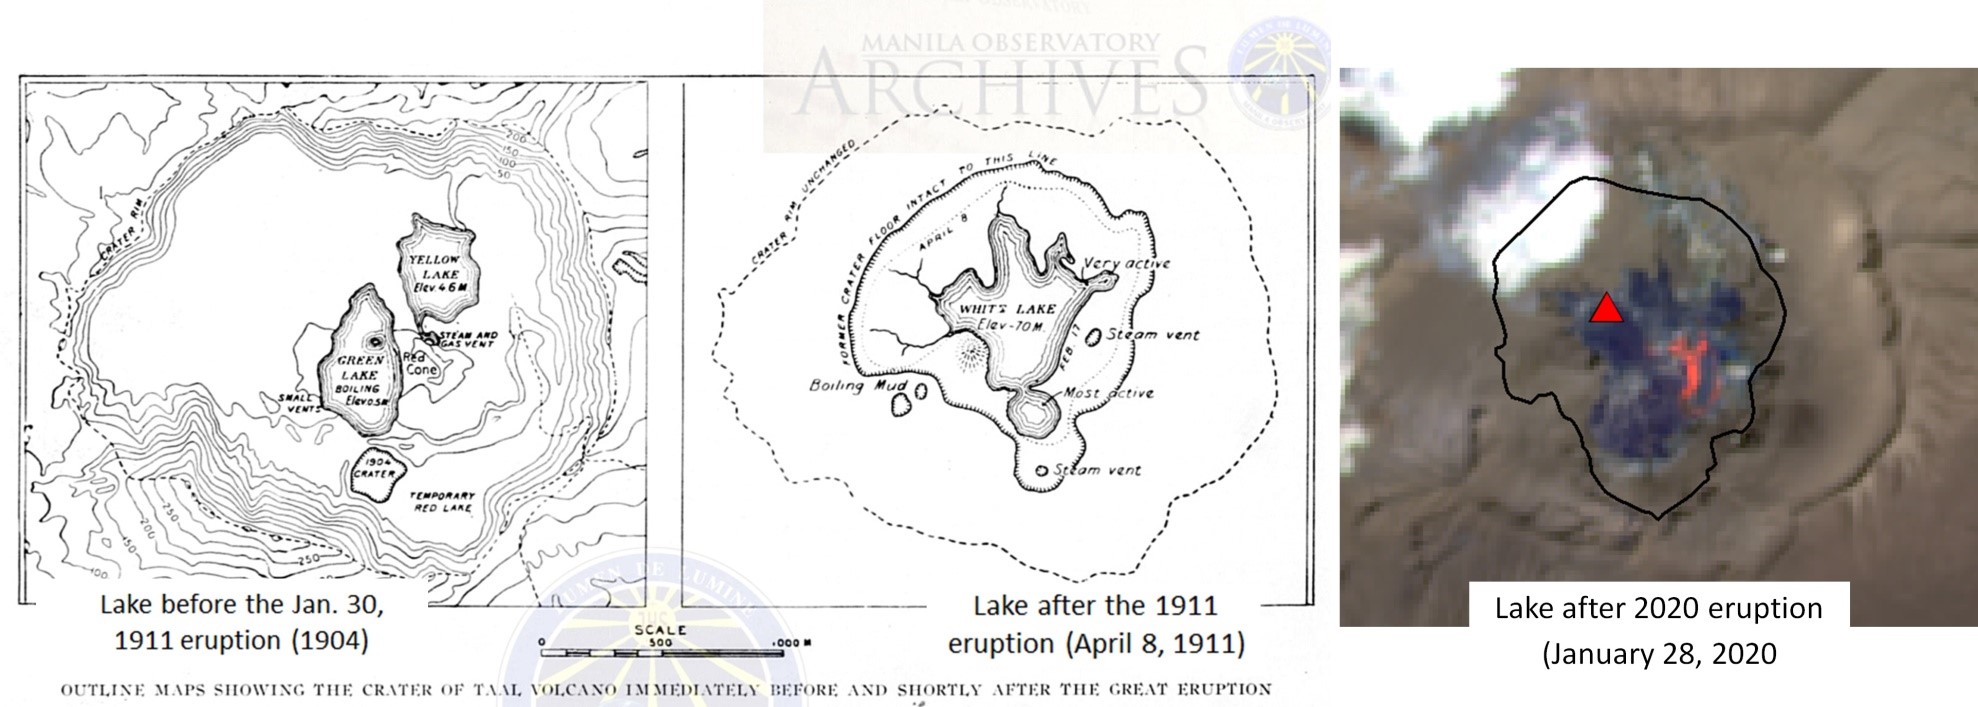
Figure 8. Before and after eruption maps of Taal’s Crater Lake in 1904 and 1911 from Fr. Maso and infrared image composite of the Crater Lake showing lava in red and hot surface in blue after its 2020 eruption (from Manila Observatory archives and image processed from Sentinel-2 image obtained through scihub.copernicus.eu)
2.2 Ash fall on Pulo
Three days after its most recent eruption, ash was detected over most of the Taal Volcano Island. In Figure 9a, ash deposits covering Taal Volcano Island are highlighted in red. Ash has a lower dielectric constant compared with vegetation that previously covered the island. Lower dielectric constant means less backscatter over the island for the post-eruption image in Figure 9a. Backscatter over the island was also reduced after the eruption, as L-band penetrates through the dry soil. When combined with the pre-eruption image, ash fall appears red.
Pulo was stripped of its pre-eruption natural colors as grey ash eventually settled to blanket the green undergrowth covering the terrain well-known to tourists and local tourist guides. This change is shown in the comparison of true-color images from Landsat 8 taken on December 3, 2018 and Sentinel 2 taken on January 28, 2020 (Figure 9b and 9c).

Figure 9. Pre and post-eruption Radar and True Color Composite Images of the volcano island (image processed using data from JAXA ALOS-2 obtained through Sentinel Asia, Landsat 8 via earthexplorer.usgs.org and Sentinel 2 via scihub.copernicus.eu)
3. Impacts on Taal Lake
3.1 Water quality
Turbidity is a measure of water clarity. Turbid water is usually characterized by a high concentration of suspended solids. Remotely, turbidity can be detected through an index called Normalized Difference Turbidity Index (NDTI) [8]. NDTI yields values from -1 to 1, with 1 indicating high turbidity and -1 indicating low turbidity. In Figures 8 to 11, red signifies high NDTI values while blue signifies low NDTI values.
We compared the NDTI of Taal Lake on December 3, 2018 and January 23, 2020 (Figure 10) and noticed no significant difference in NDTI values. White patches are points without data due to cloud cover. Note that some (bluer) portions of the lake have shadows casted by clouds. The shadows could have reduced the detected turbidity in the image.
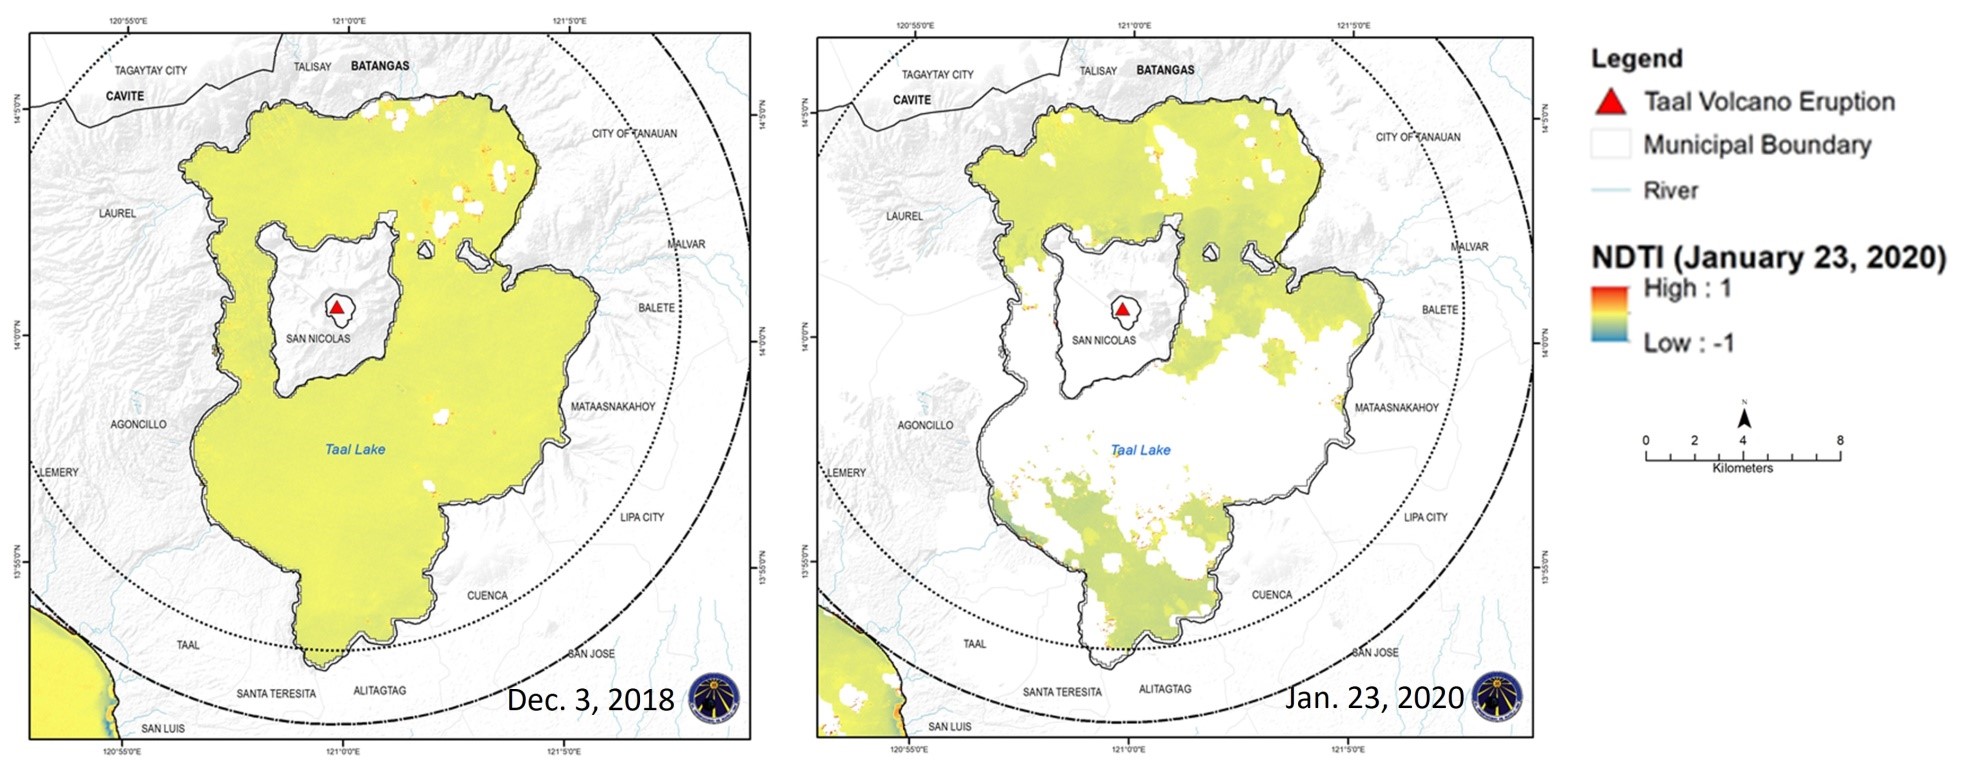
Figure 10. NDTI of Taal Lake before and after its eruption on January 12, 2020 (image processed using Landsat 8 image taken on December 3, 2018 and January 23, 2020 obtained via earthexplorer.usgs.gov)
The difference in NDTI was more pronounced in Laguna Lake (Figures 10 and 11) than in Taal Lake. However, further investigation is necessary to verify whether the cause of the increased turbidity in Laguna Lake is Taal’s eruption.
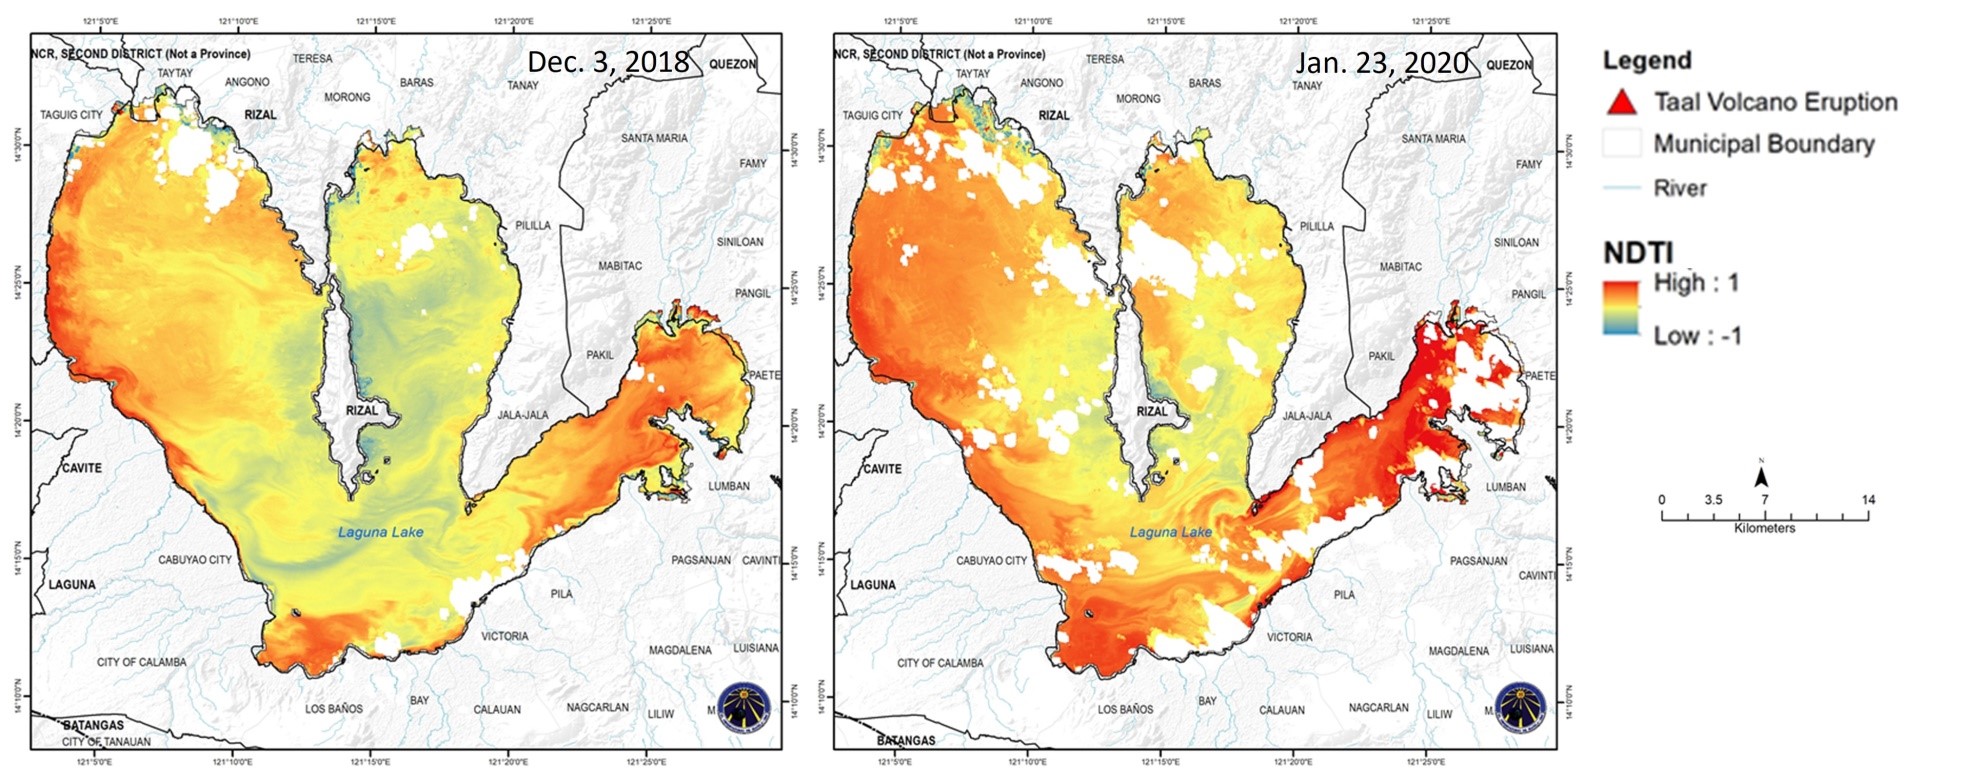
Figure 11: Laguna Lake’s NDTI before and after Taal’s eruption on January 12, 2020 (image processed using Landsat 8 image taken on December 3, 2018 and January 23, 2020 obtained via earthexplorer.usgs.gov).
3.2 Pansipit River drying up
Taal Lake, a prime tourist spot and a source of livelihood in the area, empties to Balayan Bay through the Pansipit River. The river is also being developed into a tourist destination. Local government and residents are protecting it by ensuring the river to be free from obstruction because of its importance to Taal Lake. Last January 15, 2020, residents observed that a portion of the Pansipit River dried up as shown in Figure 12. PHIVOLCS explained that the build-up of magma under Barangay Tatlong Maria caused the ground to swell and the water in the river to recede [10].
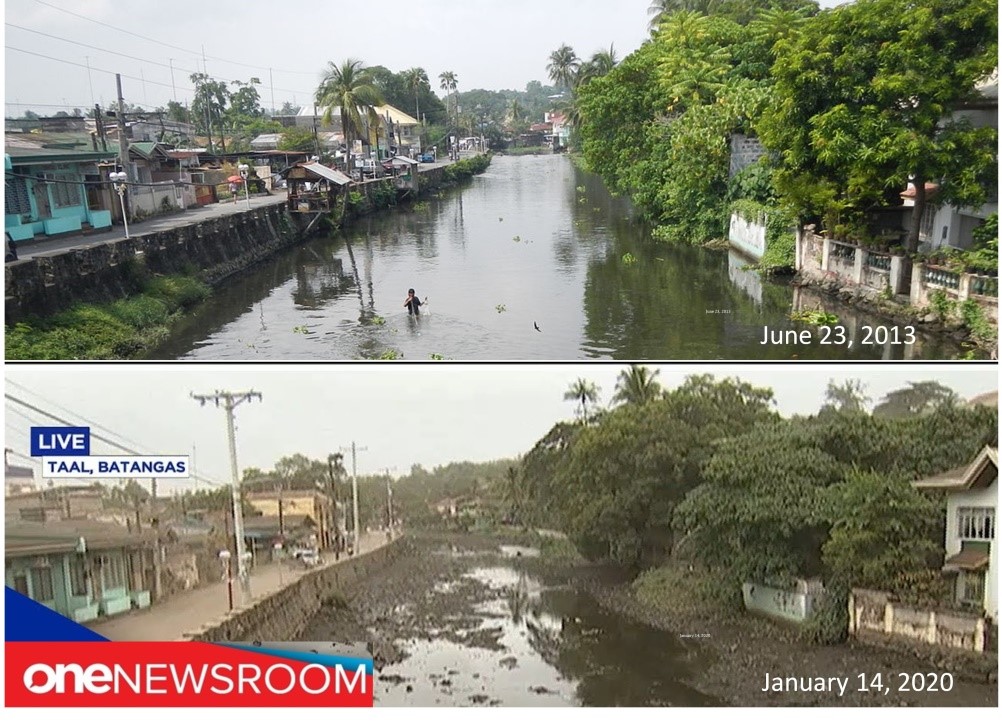
Figure 12. Image of Pansipit River from Pansipit Bridge before and after Taal Volcano’s eruption (image by Ramon F. Velasquez on June 23, 2013 via wikipedia and from ONENEWSROOM on January 14, 2020).
3.3 Aquatic Life
Fishkill followed Taal’s eruption as the lake’s acidity and temperature changed. The high concentration of sulfur upwelling from the ground to the lake changed the water’s acidity to a level that is fatal to aquatic life [12]. The most common species of fish in the lake is Tilapia. Other species in Taal Lake are Tawilis and Maliputo. After Taal’s eruption, the International Union for Conservation of Nature (IUCN) considered Tawilis as an endangered species [9].
3.4 Fish pens and fisheries
Taal’s eruption damaged thousands of fish cages as detected on radar images captured before and after the eruption (Figure 13). Taal Lake lost more than 15,000 metric tons of fish [9] amounting to PhP 1.6 billion [12].
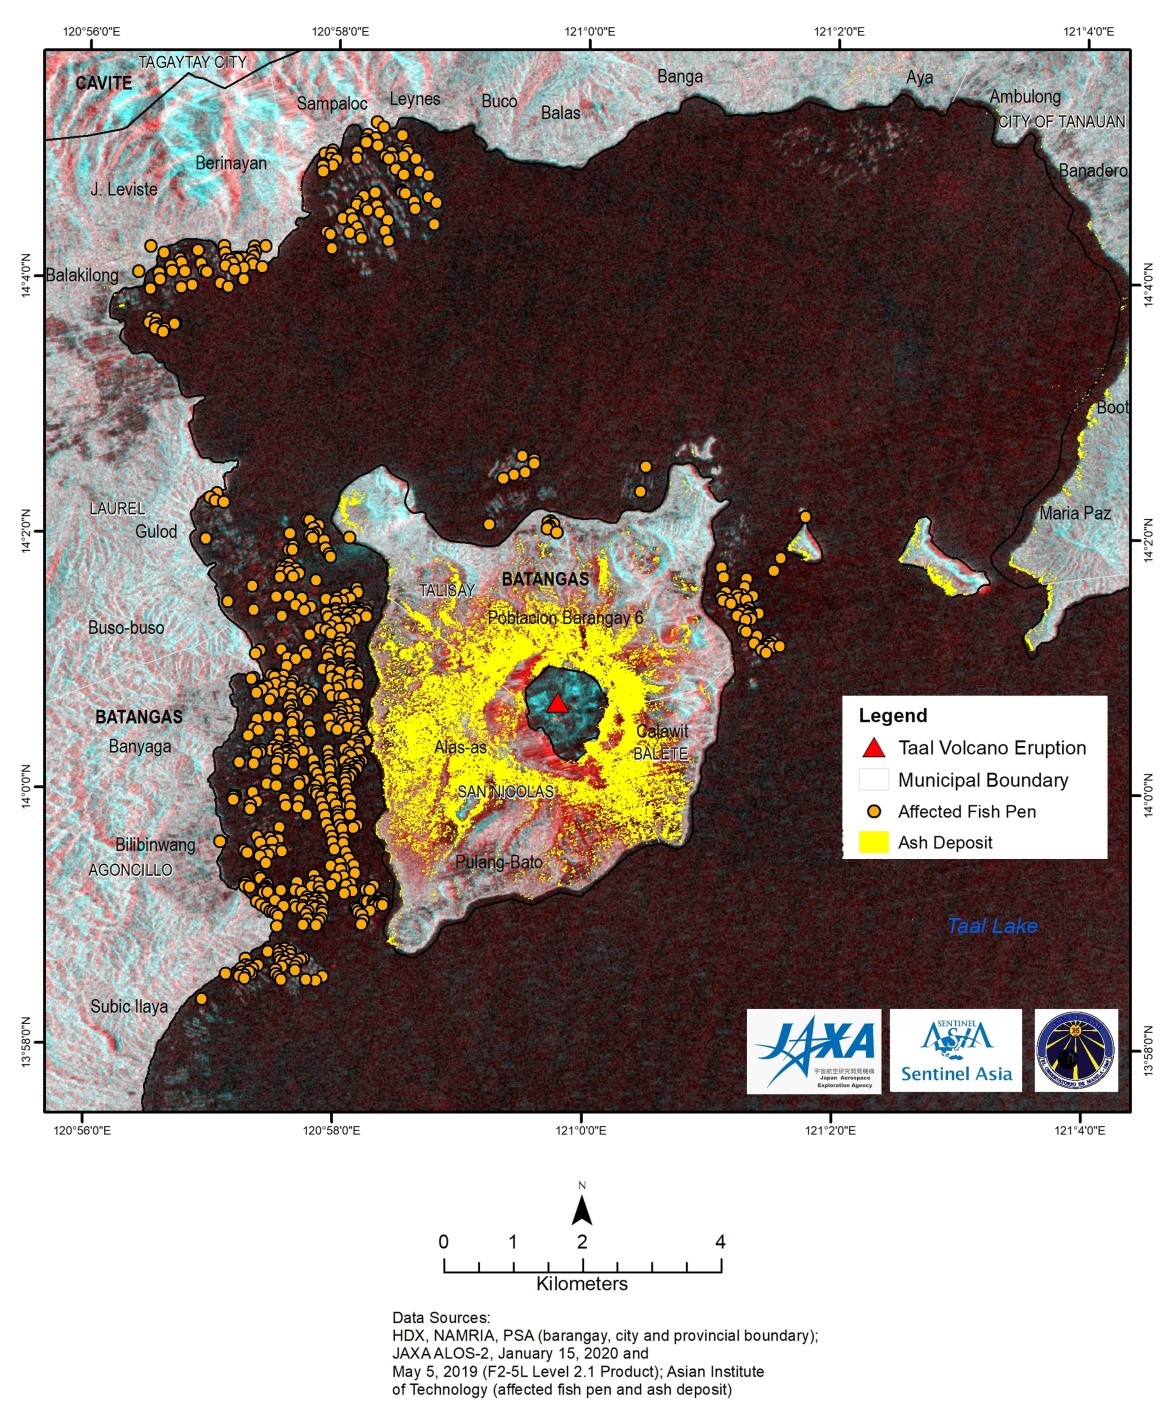
Figure 13. Affected fish pen and detected ash deposit (map processed using image from JAXA acquired through Sentinel Asia and information on fishpens and ashfall extracted by Asian Institute of Technology).
4. Impacts of Ashfall on the Surrounding Municipalities
Taal Volcano’s Phreatic Eruption emitted ash that reached Batangas, Cavite, Laguna, Metro Manila, Rizal, and Bulacan (Report Part I) on January 12, 2020. The following day, smoke and ash coming from Taal Volcano moved southwestward towards Agoncillo, Lemery, and Taal as shown in Figure 14.
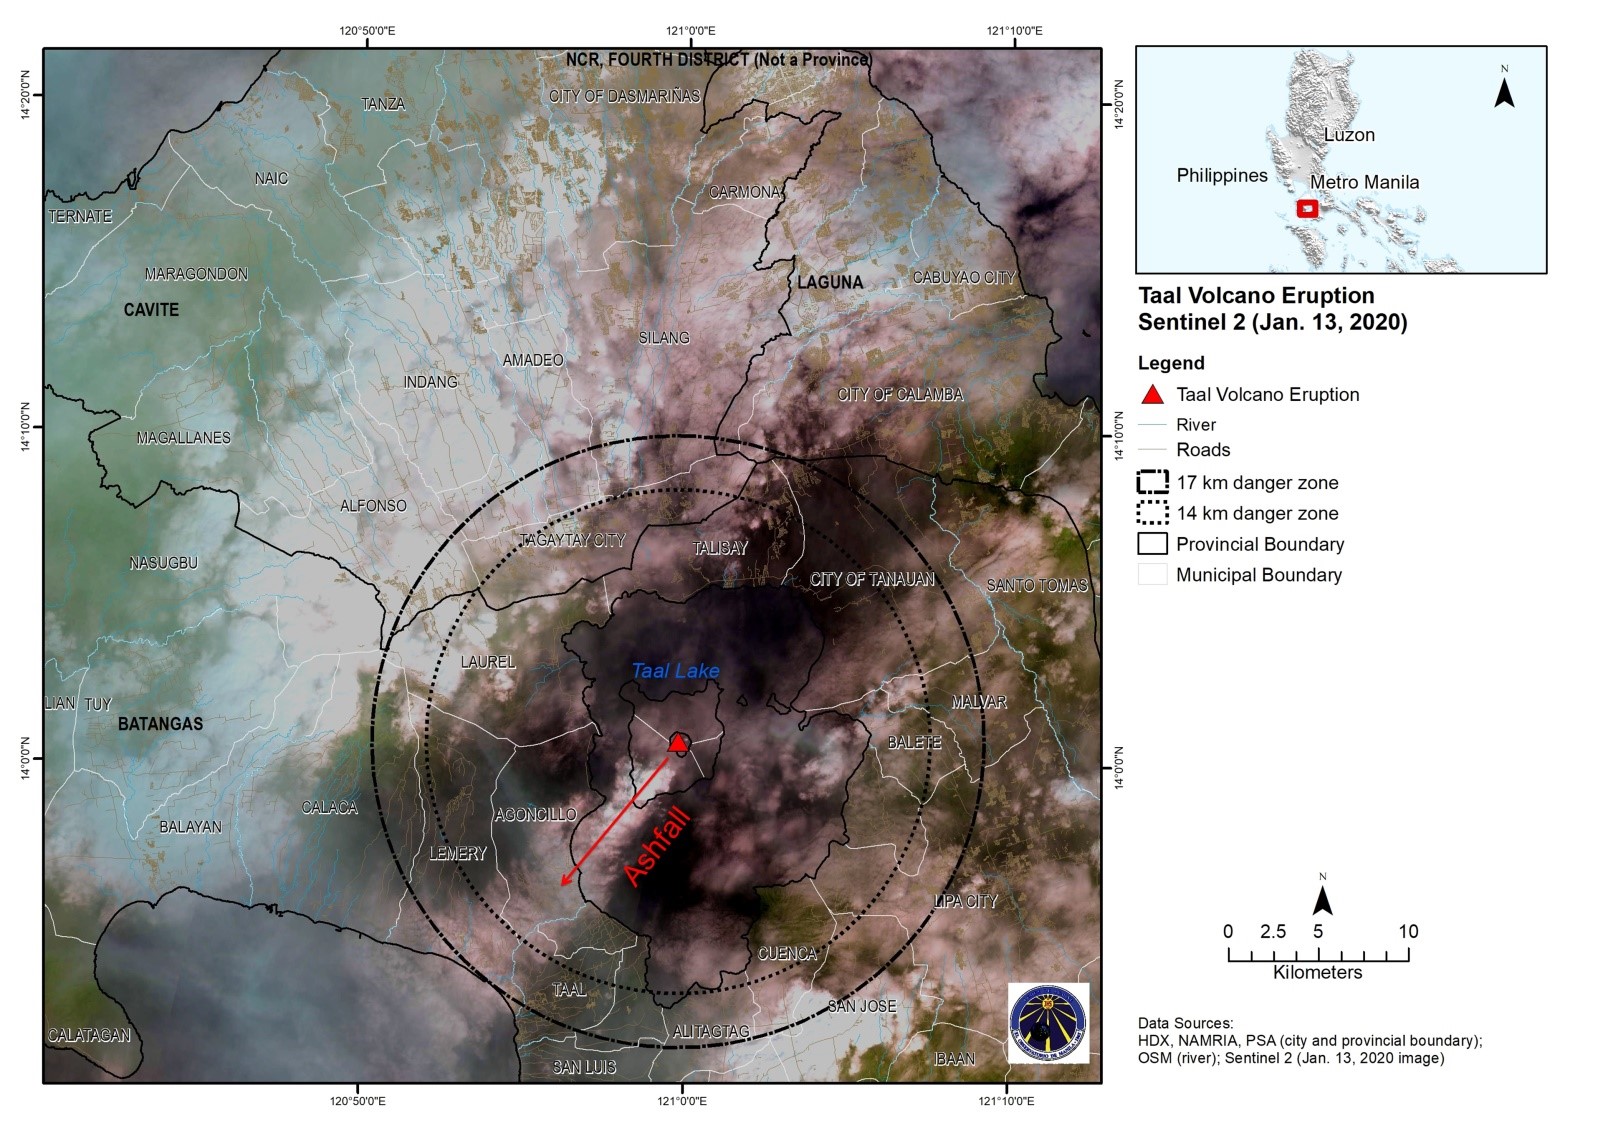
Figure 14. Smoke and ash coming from Taal Volcano on January 13, 2020 (image processed using data from European Space Agency).
4.1 Detectable ash deposits from space
On January 12, 2020, volcanic particles were transported by high elevation winds northward (see Part I Report). The Sentinel-2 image taken on December 3, 2018 (Figures 15a) showed the towns around Taal Volcano before it erupted. The following image (Figure 15b) showed ash-covered municipalities along the northern shores of Taal Lake. Ash deposits were seen as far as Sta. Rosa Laguna (Figure 16). The image also showed ash covering the western shores of Taal Lake specifically the municipalities of Laurel and Agoncillo, two of the municipalities under lockdown (highlighted in yellow). On January 26, 2020, the lockdown of other municipalities, except Laurel and Agoncillo, were lifted.
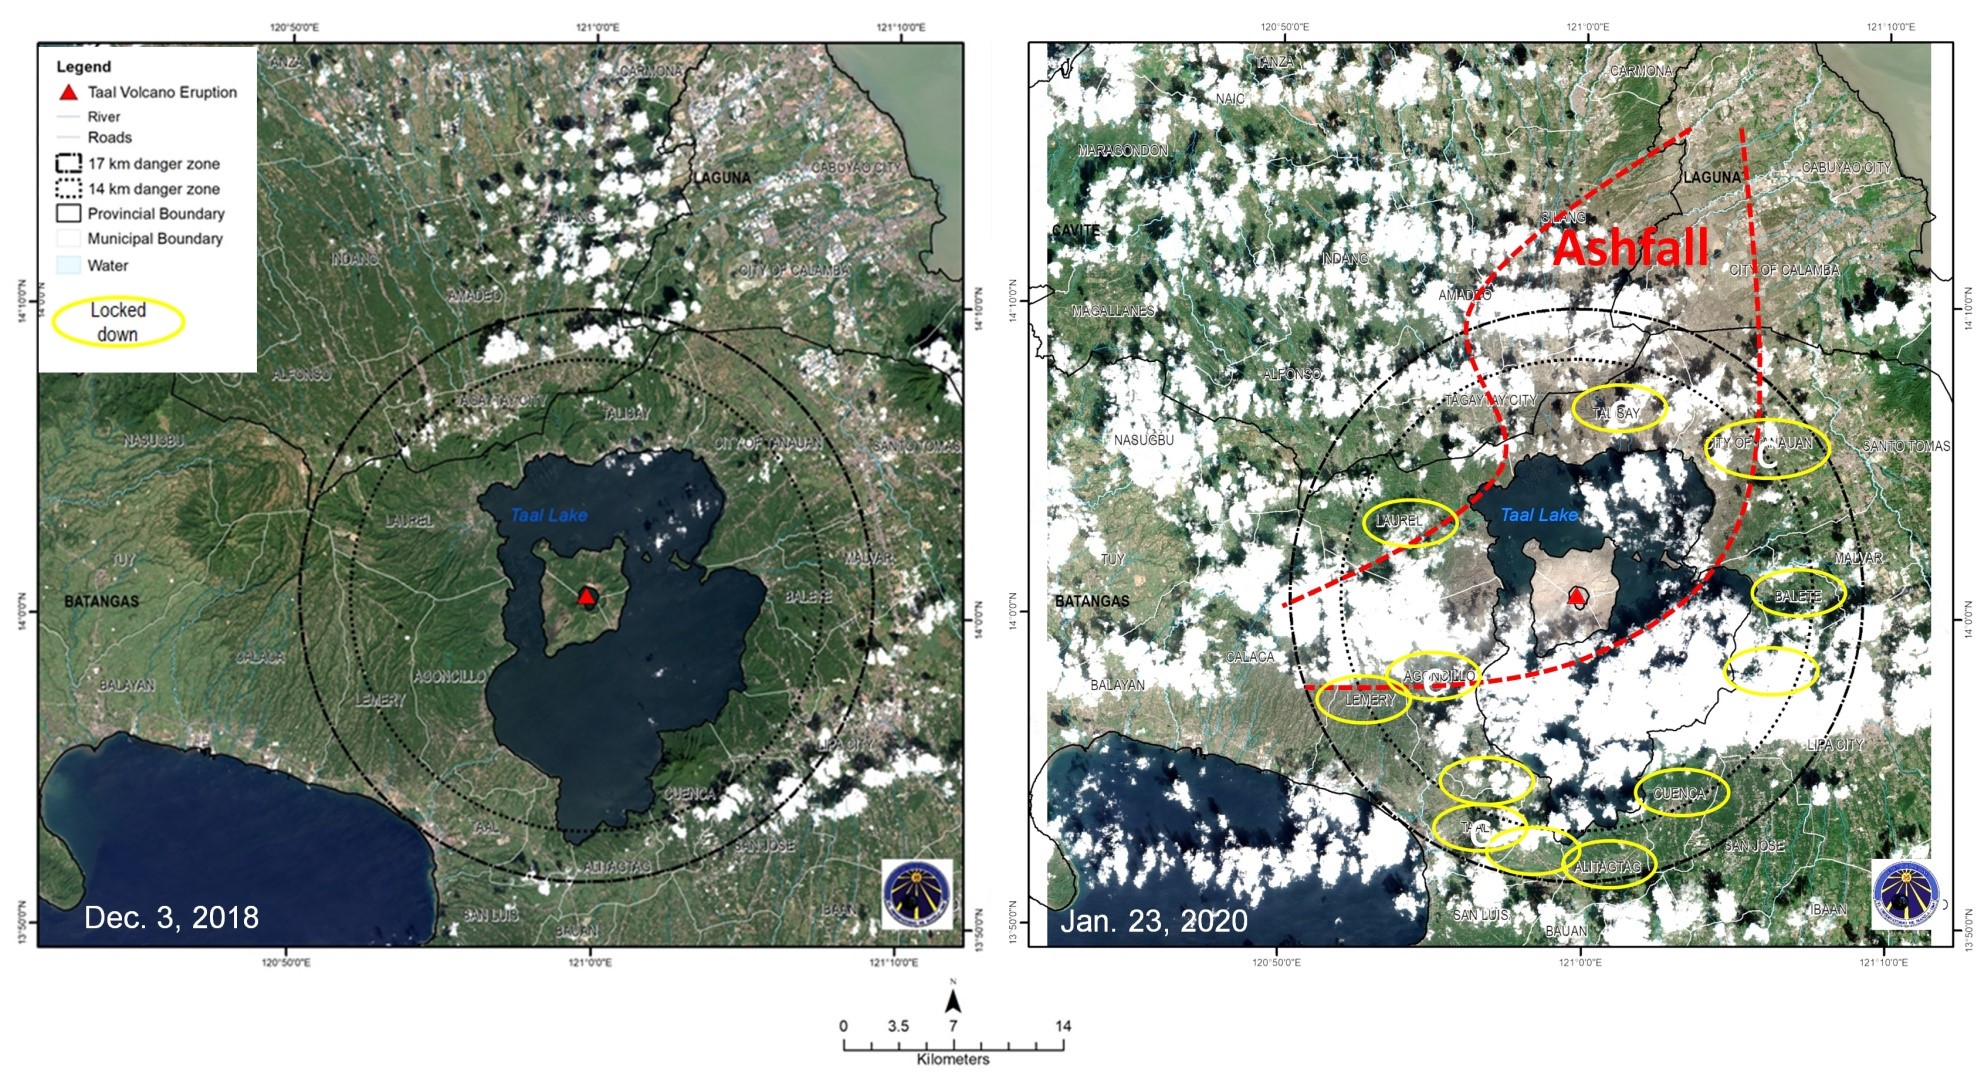
Figure 15. Pre- and post-eruption image of Taal and neighboring provinces showing the estimated extent of ashfall detected by the satellite (image processed using Landsat 8 from United States Geological Survey via earthexplorer.usgs.gov and Sentinel-2 data from European Space Agency via scihub.copernicus.eu with information from NDRRMC Situation Report and Openstreetmap.org).
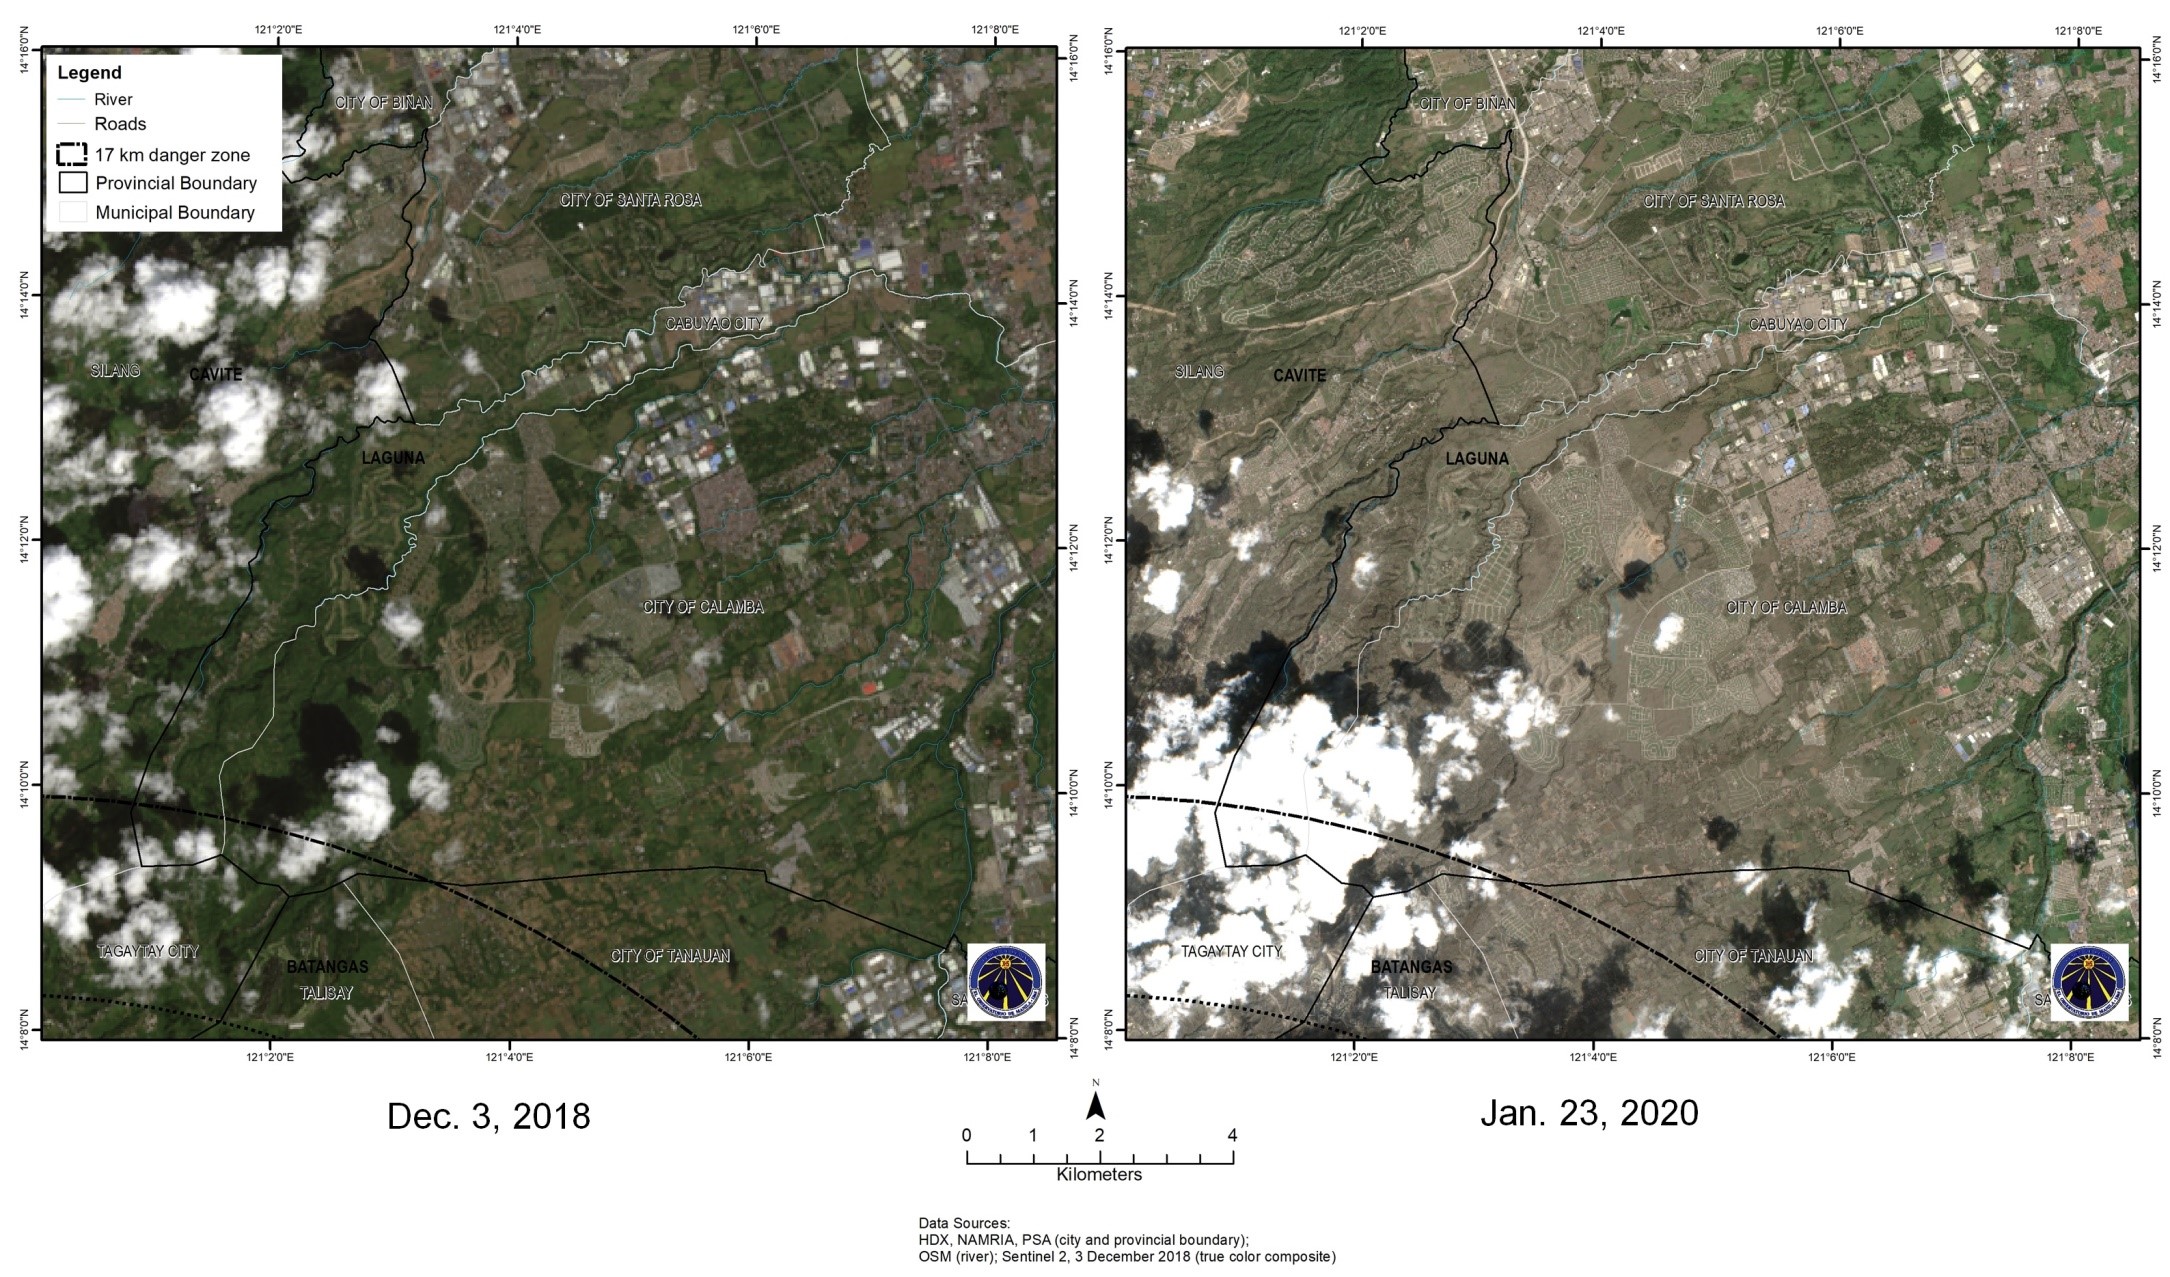
Figure 16. Zoomed-in Pre- and post-eruption image of Taal and neighboring provinces showing the estimated extent of ashfall detected by the satellite (image processed using Landsat 8 from United States Geological Survey via earthexplorer.usgs.gov and Sentinel-2 data from European Space Agency via scihub.copernicus.eu).
The satellite image taken before the eruption shows Laurel’s small town and agricultural areas (Figure 17 and Figure 18). The image after the eruption shows Laurel as an ash-covered town (Figure 17 and 18). The downtown area including some key locations of Laurel was covered with ash (Figure 18). The surrounding agricultural lands have also been covered by ash. From the same image can be inferred former towns that were completely obliterated after the 1911 eruption of Taal. For example, the towns of Bosoboso and Banaga once stood in Laurel’s current. Formerly called Bayuyungan, the Municipality of Laurel is now home to roughly 40,000 people whose main source of livelihood is fishing (as shown in Figure 13) and farming (see the location of croplands on Figure 19). In addition, among the municipalities within the 17km danger zone, Laurel has the highest poverty incidence.
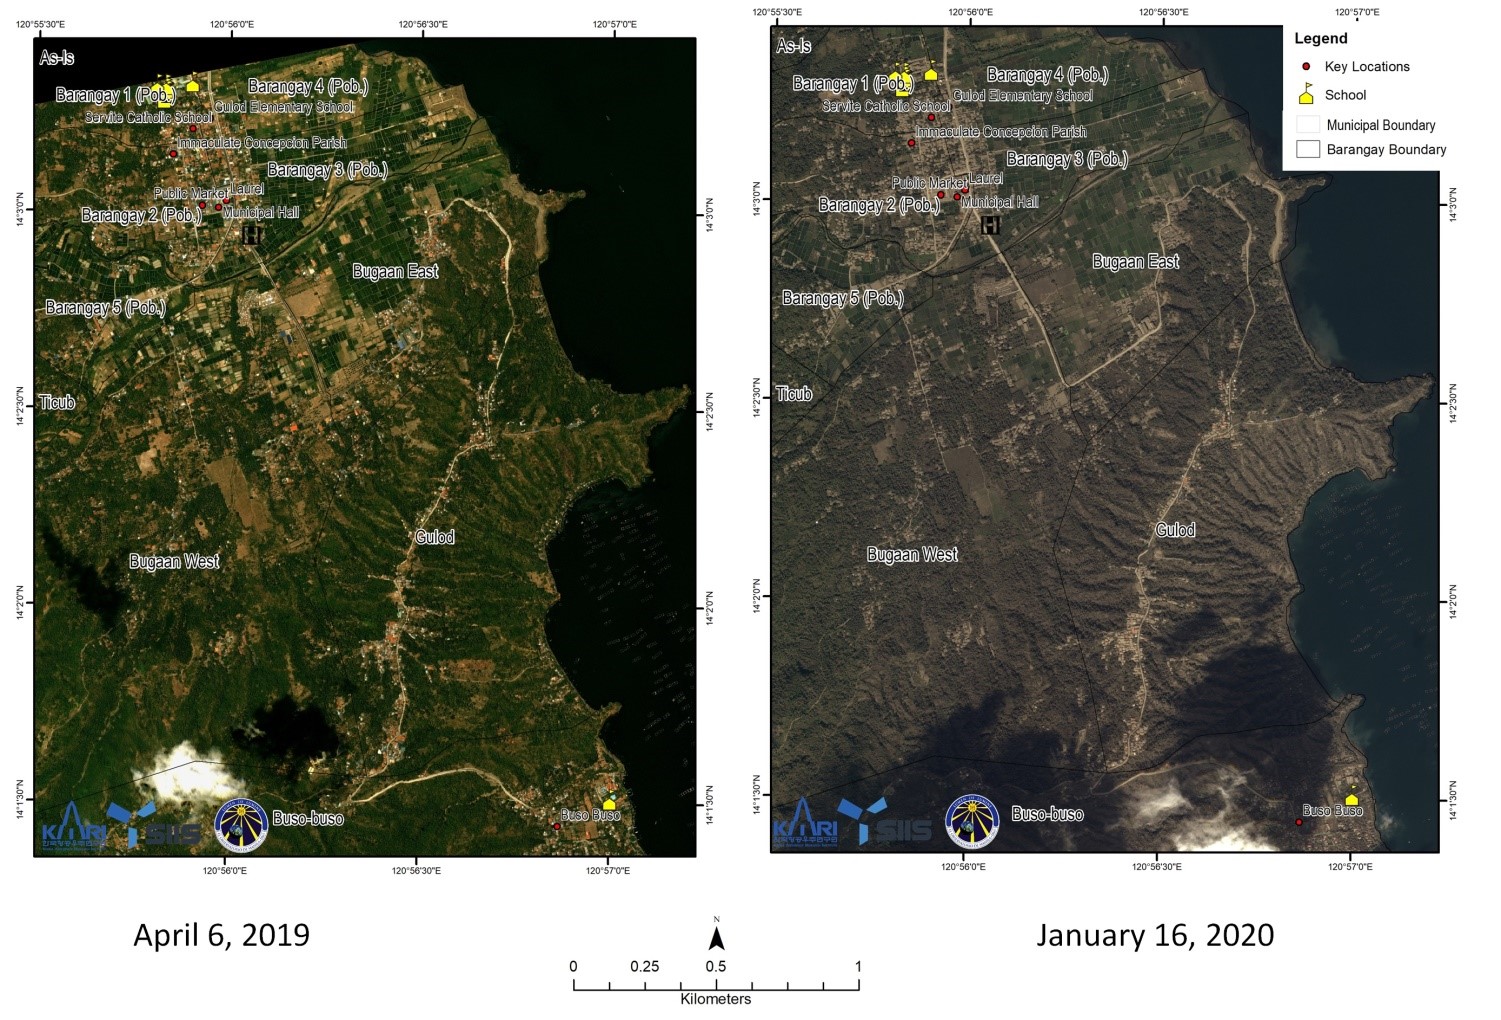
Figure 17. True color image of Laurel, Batangas, taken before (April 6, 2019) and after (January 16, 2020) the eruption (image processed using KOMPSAT-3A data of Korea Aerospace Research Institute obtained from SI Imaging Services).
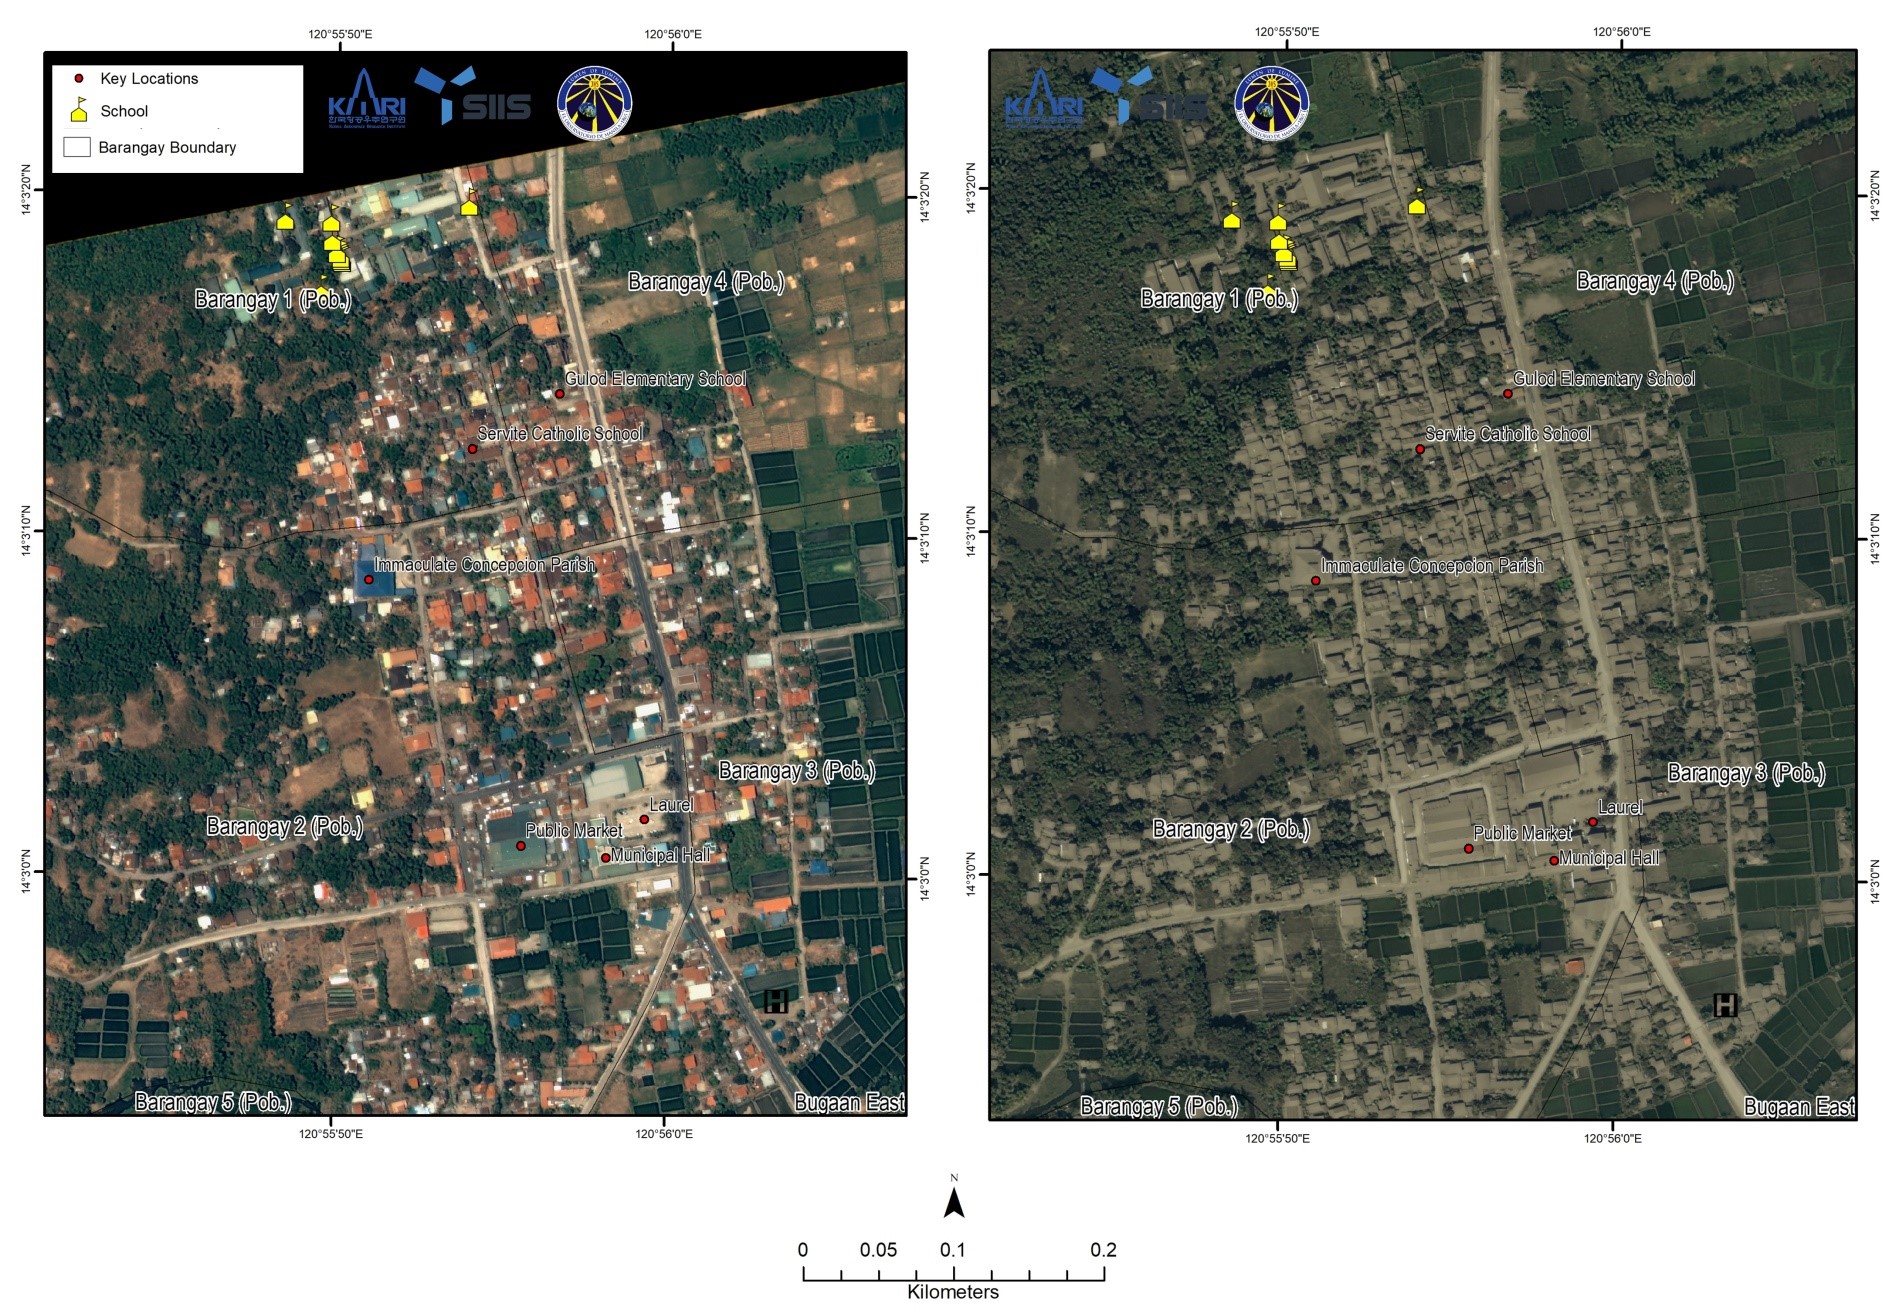
Figure 18. True color image of Laurel, Batangas, taken before (April 6, 2019) and after (January 16, 2020) the eruption (image processed using KOMPSAT-3A data of Korea Aerospace Research Institute obtained from SI Imaging Services).
4.2 Land cover
Within the 14 and 17 km danger zones, there are mostly perennial croplands along the east and west shores (Figure 19). These perennial croplands are sources of high value cash crops that incurred roughly PhP 1.4 billion [14] worth of damage within the affected areas. Affected crops include pineapples, coconuts, and coffee. Brushland patches can be found on the borders of Laurel and Agoncillo and between Talisay and Tagaytay. Most of the built-up areas within the 14 and 17 km danger zones are located in Tagaytay. Some built-up areas are also located in Lemery, Talisay (former location of Tanauan) and San Nicolas (former location of Taal).
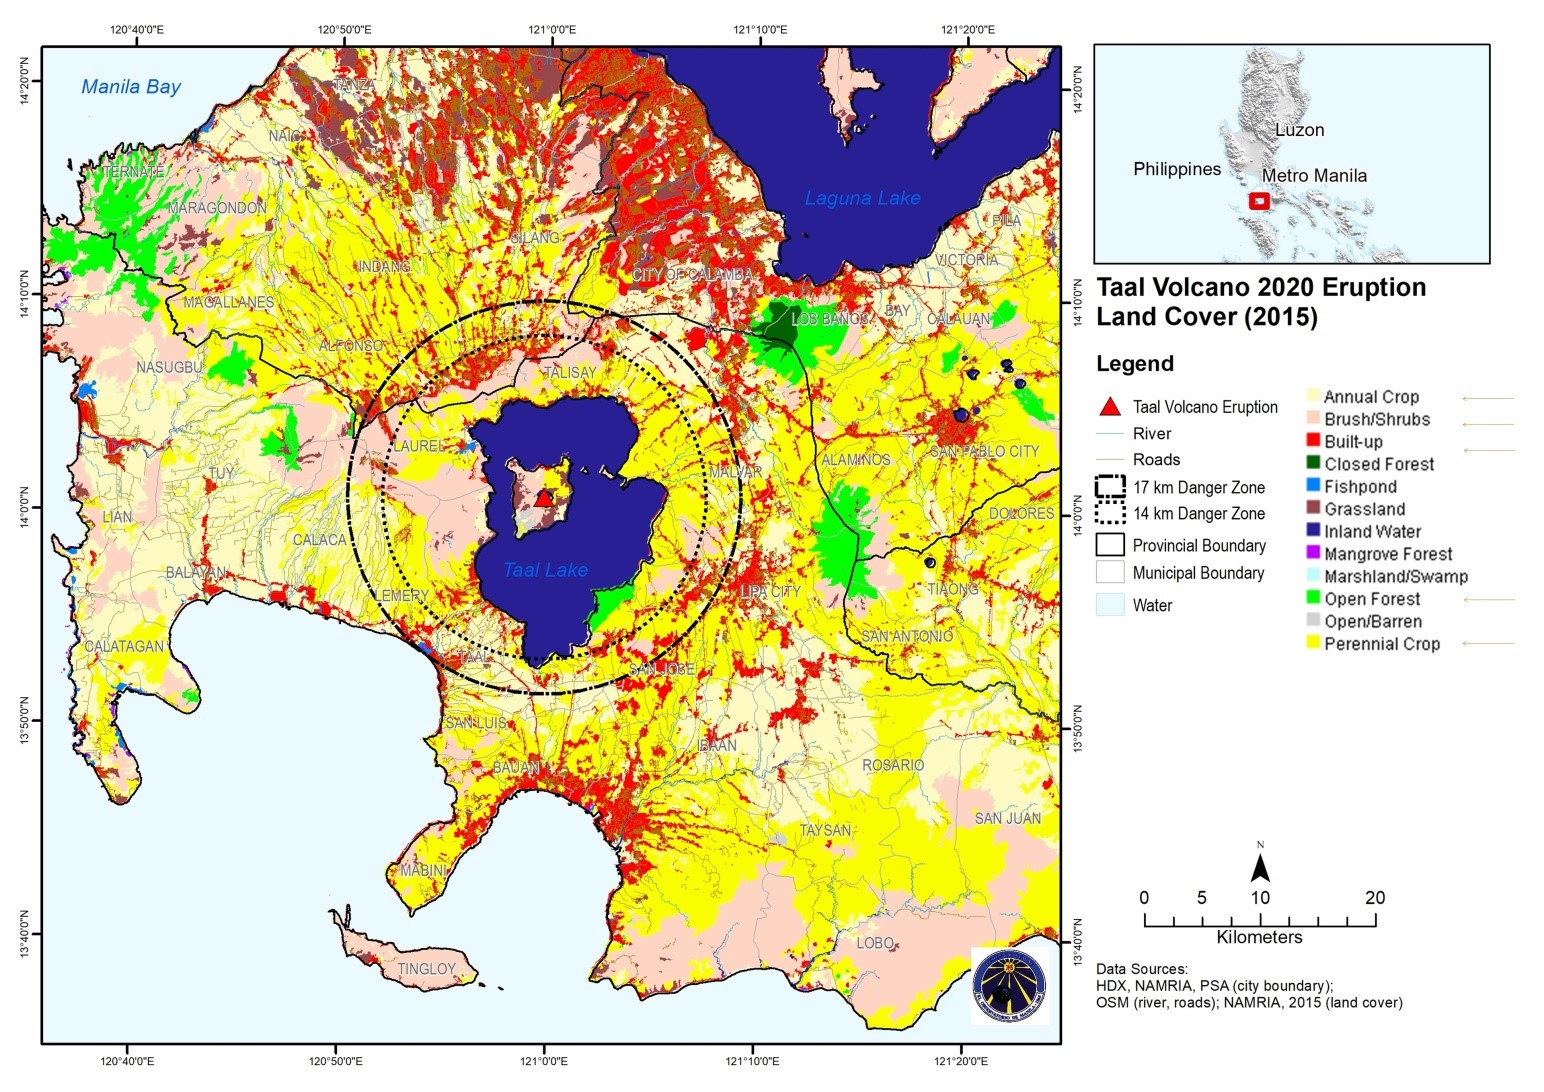
Figure 19. 2015 Land cover (land cover data from NAMRIA).
4.3 Buildings and evacuation sites
Of the cities and municipalities within the 14 and 17 km danger zones, Tagaytay City has the most number of buildings (Figure 20). Ashfall covered the buildings and other built structures in Laurel and Agoncillo in Batangas. Aside from these two municipalities, Lemery, Tanauan, and Talisay in Batangas were also covered with ash. Similarly, buildings in Amadeo, Silang, and Tagaytay City in Cavite were affected by ashfall. Ashfall was also remotely-detected to cover buildings in Sta. Rosa and Calamba in Laguna. On the ground, ashfall was reported in other parts of CALABARZON, Metro Manila, and Central Luzon. Some evacuation centers are located within the 17 km danger zone but most are not affected by ashfall. Most of these evacuation centers are located in highly-populated barangays outside the danger zone (Figure 21 and 22).
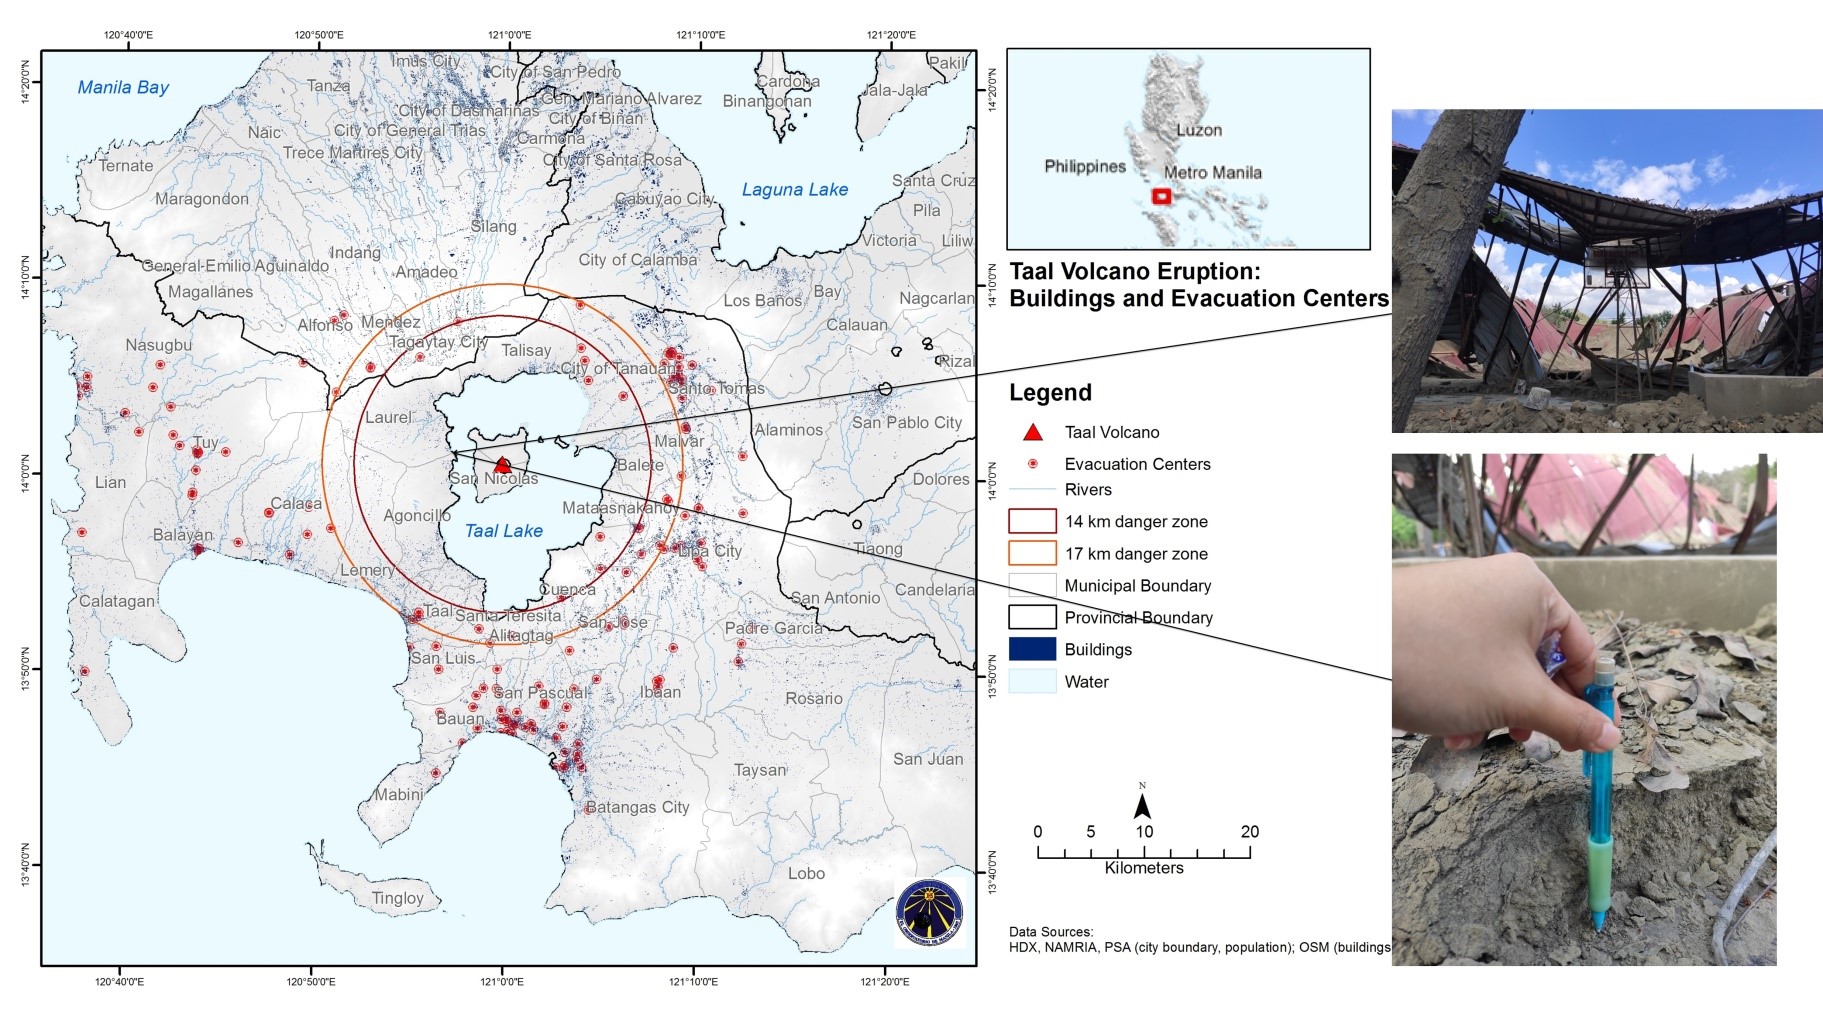
Figure 20. Buildings and ashfall (as of January 23, 2020) (data source: Google Consolidated map of evacuation centers and Openstreetmap.org. Ash of around 10 cm thick accumulated on top of a table in Buso-buso, Laurel, Batangas. Roof of a basketball court collapsed due to the weight of the ash. Photos taken on March 4, 2020).
4.4 Population and Development
Metro Manila’s population has spilled over to Laguna and Cavite, the neighboring provinces of Batangas (Figure 21). Ashfall was able to reach these highly-populated areas of Laguna. Even though the population is not as high and as concentrated in the towns within the 14 and 17 km danger zones, the residents within the 17 km danger zones had to evacuate their homes and leave their properties.
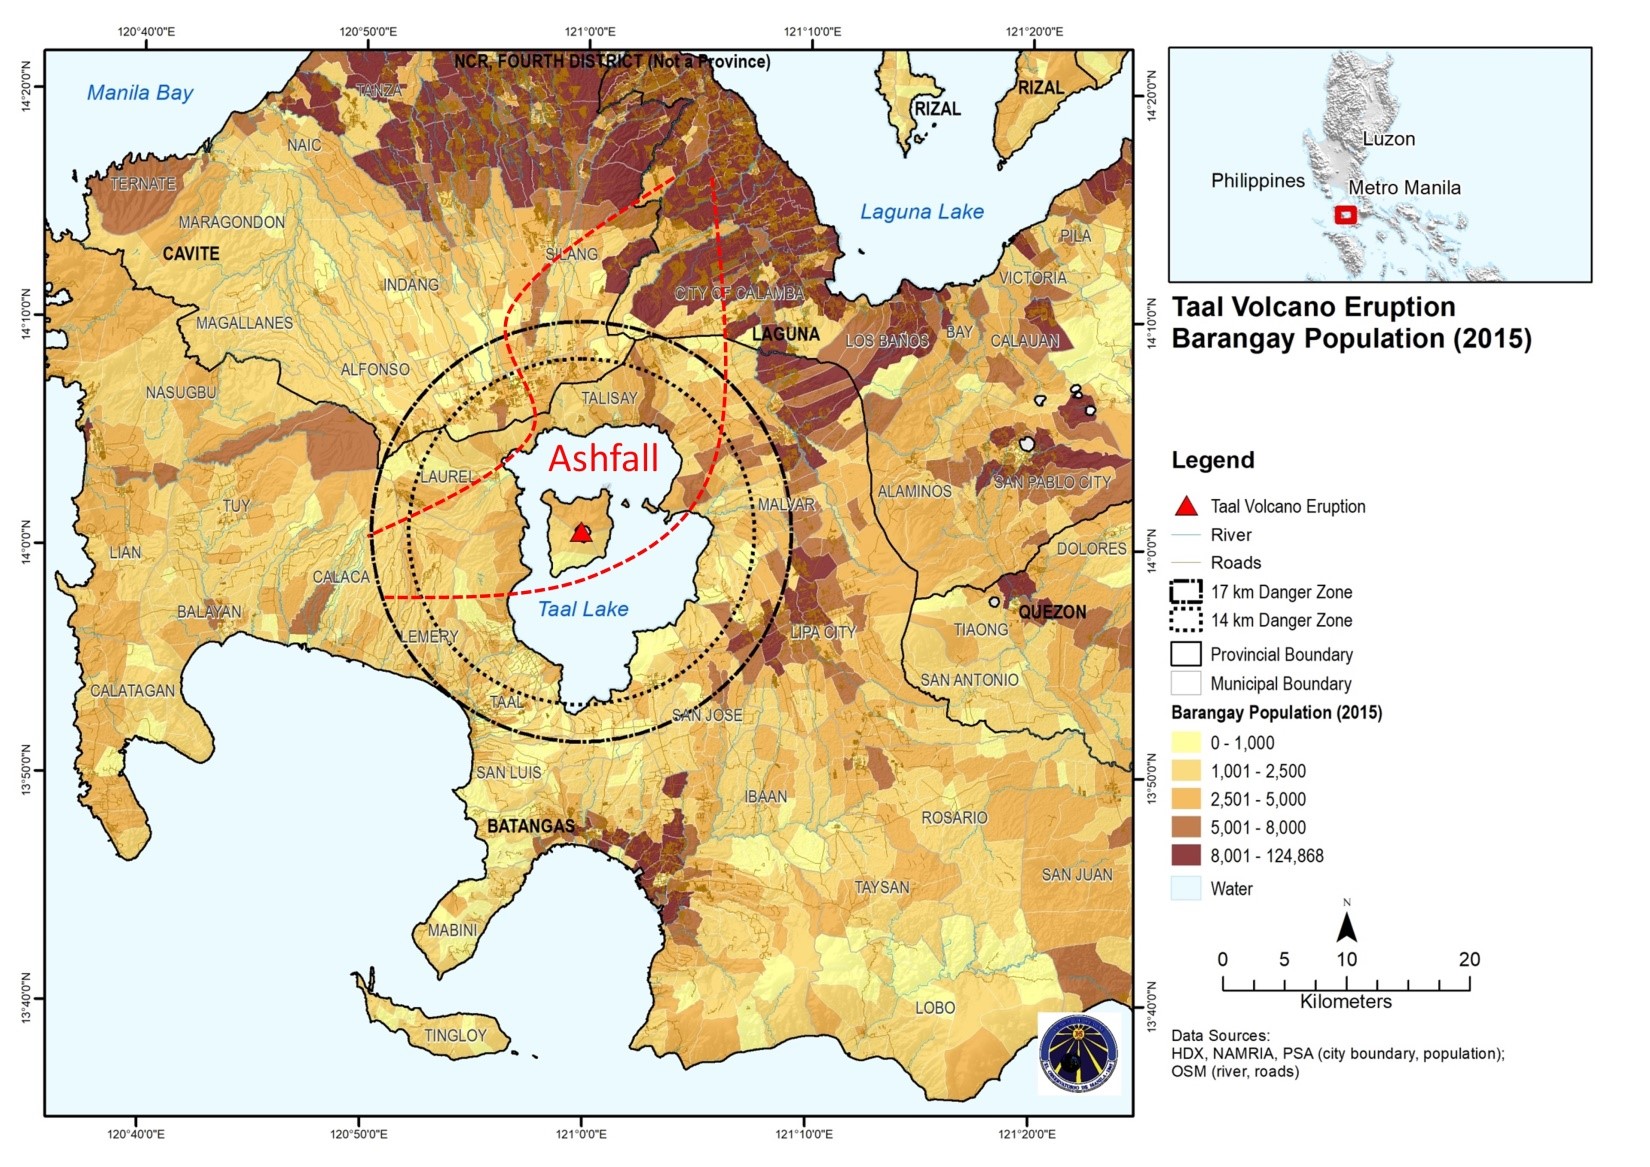
Figure 21. Barangay Population (2015) (data source: Philippine Statistics Authority).
Within the danger zone, the population density (Figure 22) was highest in the former locations of Taal, Tanauan, and Lipa (see Figure 23 and Figure 24). These towns were greatly damaged and had to be relocated to their present site after the 1754 eruption, the strongest of Taal’s eruption in recorded history.
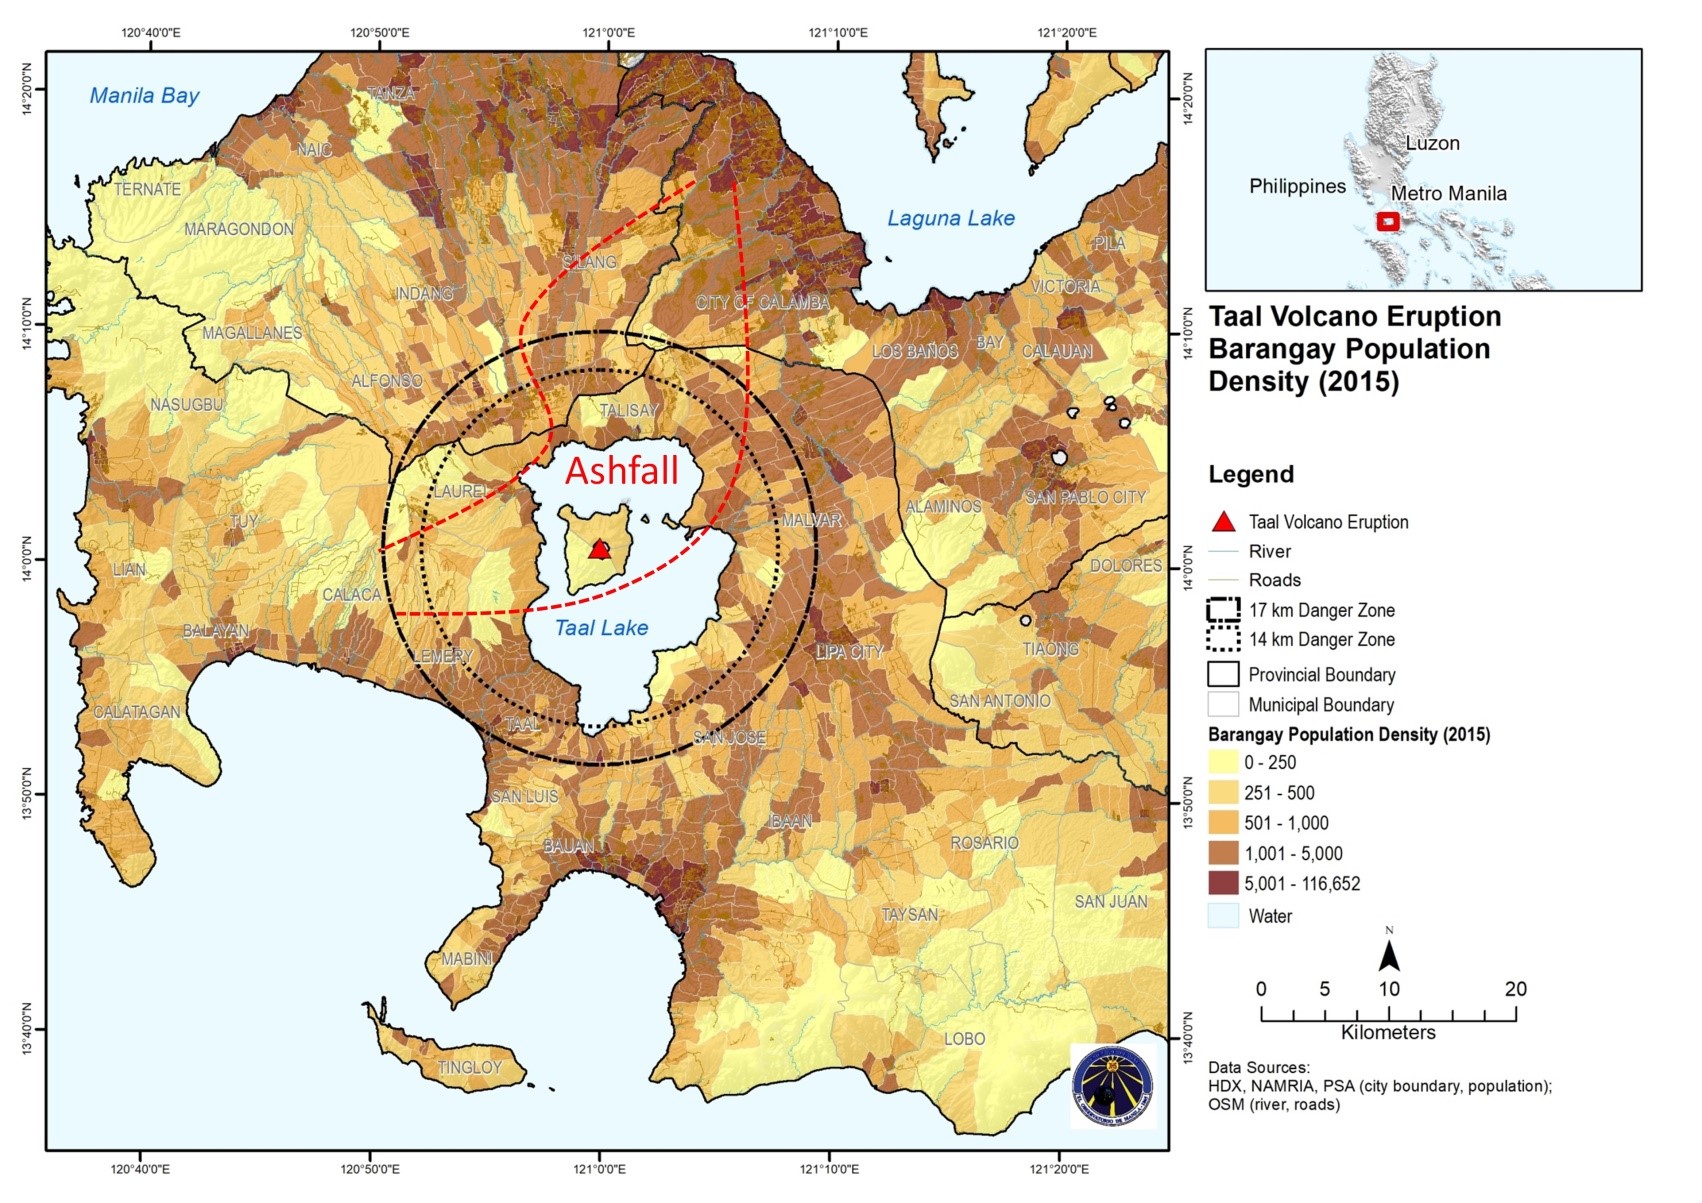
Figure 22. Barangay Population Density (2015) computed as the barangay population per square kilometer.
The 1911 eruption was the last eruption that happened on the main crater of Taal Volcano. This eruption obliterated towns on the volcano island and towns on the western shore of Taal Lake, now replaced by Laurel and Agoncillo, as shown in Figures 23 to 25.
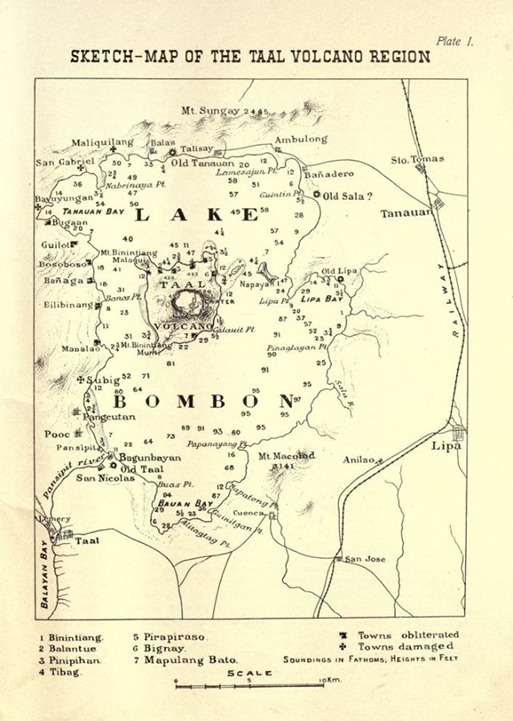
Figure 23. Sketch map of Taal after its eruption on January 30, 1911 made by Fr. Maso [21].
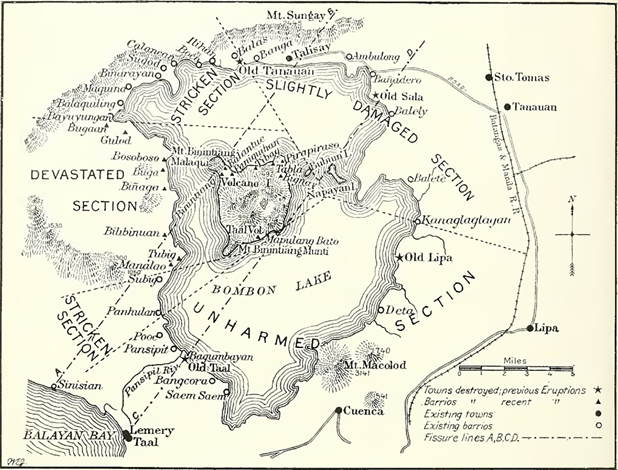
Figure 24. Worcester’s map of 1911 Taal Volcano Eruption (Map source:1912 The National Geographic Magazine compilation) [22].
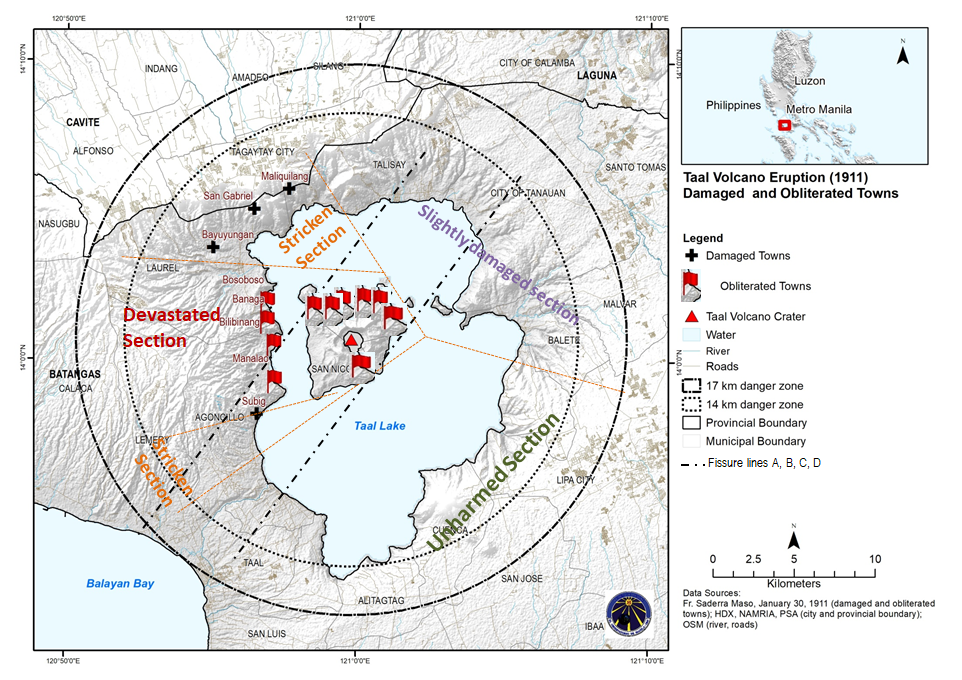
Figure 25. Map showing the damages based on Worcester’s and Maso’s Map after the eruption in 1911 [21][22].
According to Philippine Statistics Authority (PSA), poverty incidence is the “proportion of families/individuals with per capita income/expenditure less than the per capita poverty threshold to the total number of families/individuals [15].” Among the municipalities and cities within the 17 km danger zone, Laurel has the highest poverty incidence. Having a high poverty incidence indicates people’s reduced ability to cope and adapt to hazards. Aside from the damaging effects of ashfall on livelihoods and properties, this municipality has also been experiencing numerous earthquakes (Figure 28) and ground deformation (Figure 23).
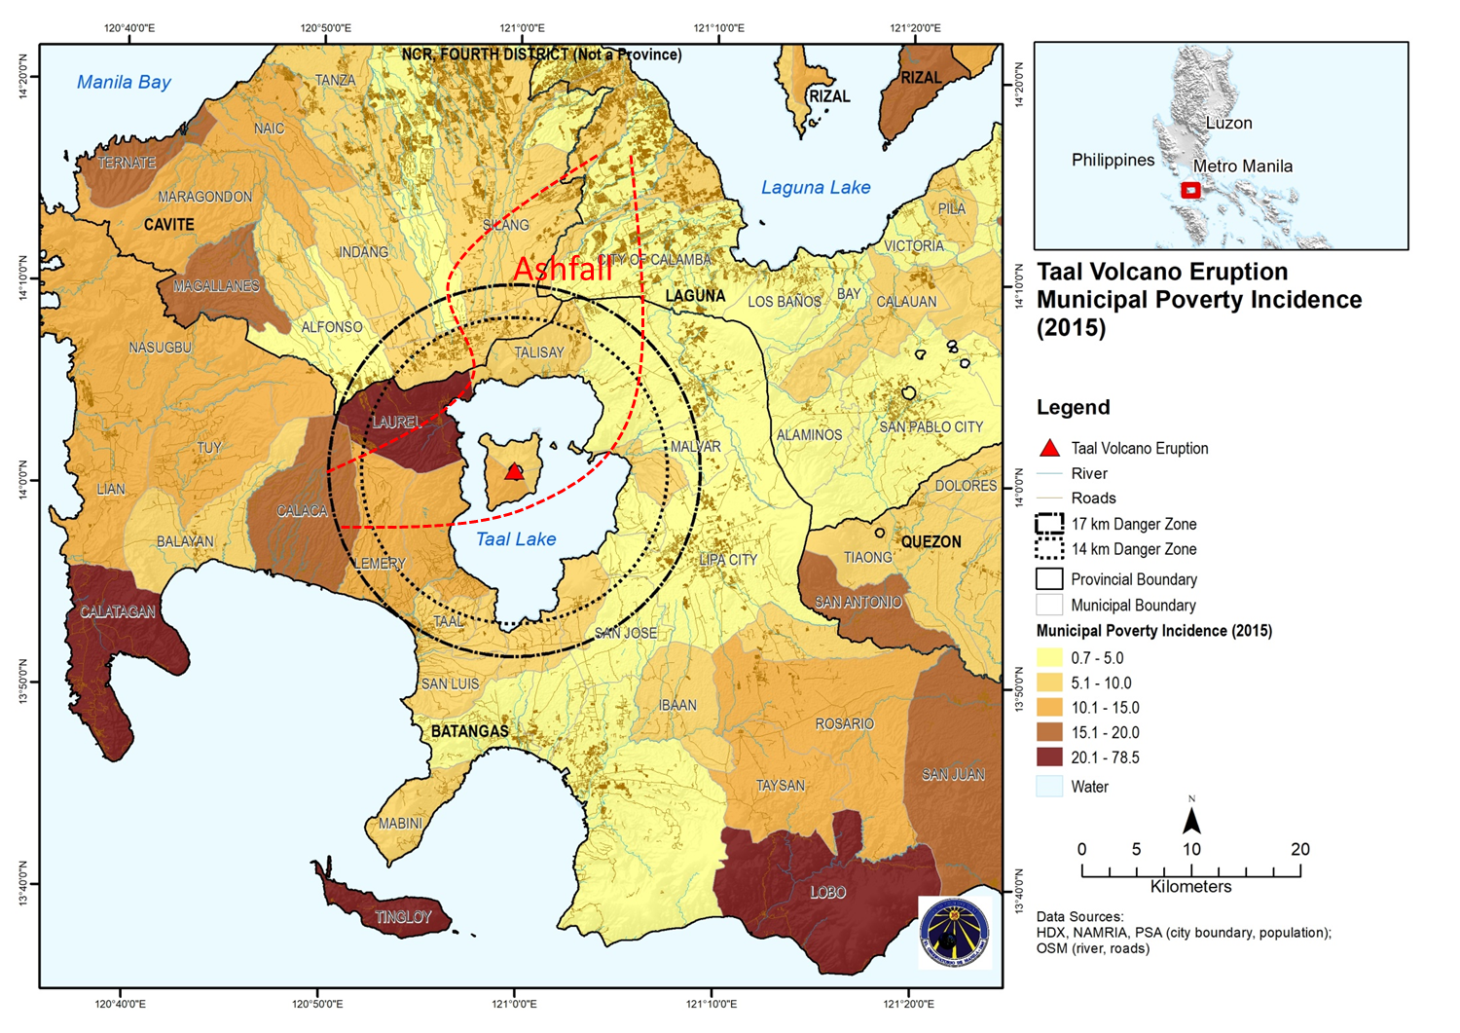
Figure 26. Municipal poverty incidence (source: Philippine Statistics Authority).
5. Earthquakes and Ground Deformation
Almost 1,600 earthquakes, mostly weak and volcanic, with magnitudes ranging from 1.2 up to 4.1, have been recorded by PHIVOLCS around Taal Volcano starting January 1 up to January 26, 2020 (Figure 27). The day after the eruption, January 13, 2020, the most number of earthquakes (197 earthquakes in one day) were recorded. Earthquakes, resulting from magmatic movement underneath a volcano, indicate volcanic activity [13]. These volcanic earthquakes are usually weak but become more frequent as volcanic activity intensifies. The epicenter of most of these earthquakes swarmed at the western side of Taal Lake, around Agoncillo and Lemery (Figure 28). The number of earthquakes per day has dropped in the past days (Figure 26).
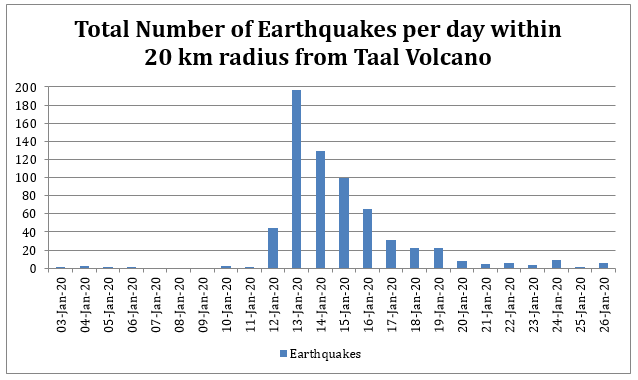
Figure 27. Total Number of earthquakes around Taal Volcano per day (data source: PHIVOLCS).
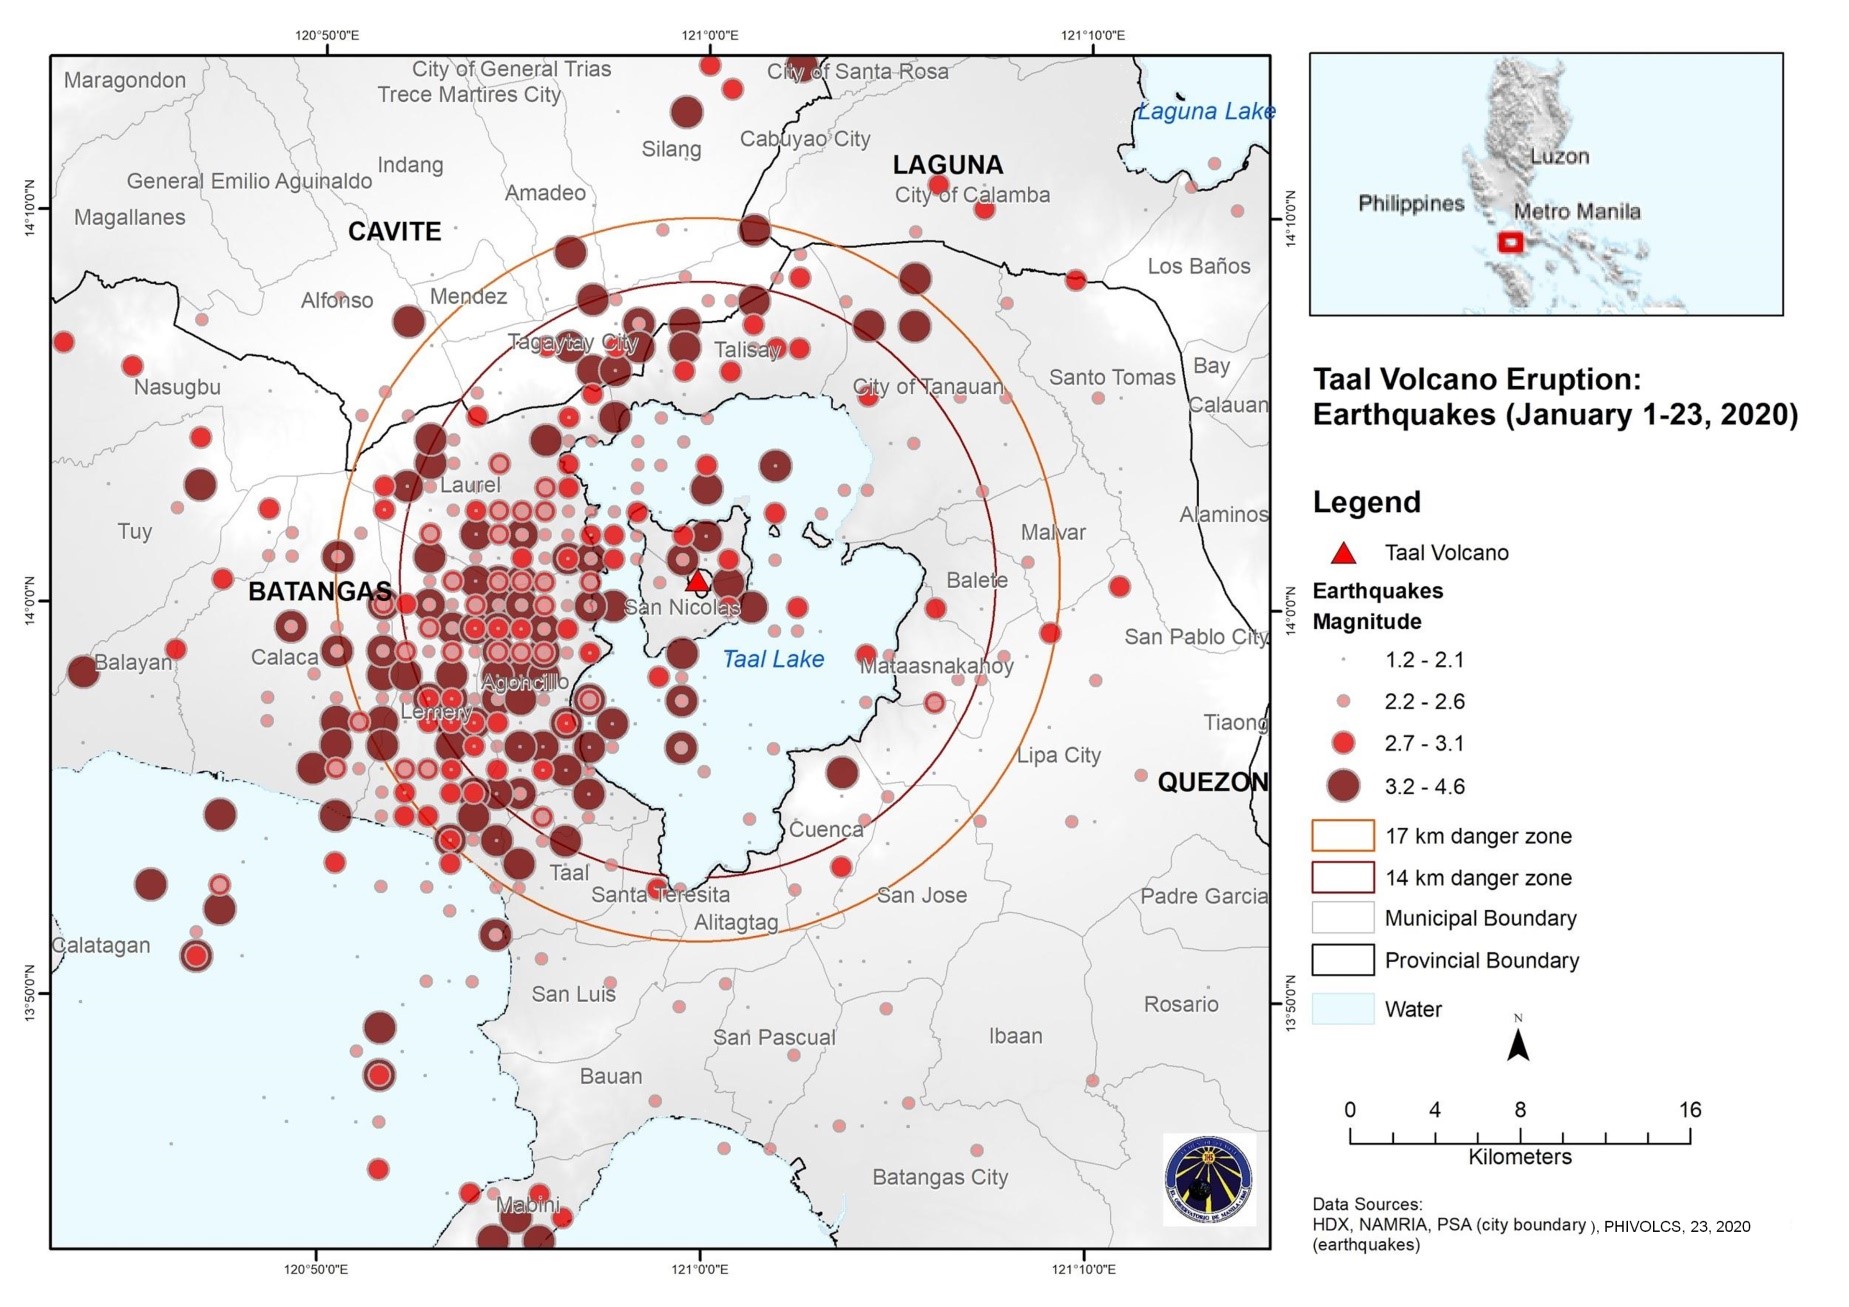
Figure 28. Earthquakes around Taal Volcano as of January 23, 2020 (data source: Philippine Institute of Volcanology and Seismology (PHIVOLCS-DOST).
Numerous earthquakes caused ground fissures, as observed in Lemery, Agoncillo, San Nicolas and Talisay in Batangas, the same locations recorded in 1911 (Figures 23 to 25). Fissures are manifestations of ground deformation resulting from the movement of magma underground. This ground deformation can be detected by looking at the displacement observed through Interferometric Synthetic Aperture Radar (InSAR) images. Interferometric Synthetic Aperture Radar (InSAR) detects ground deformation and displacement by measuring changes in elevation from two images taken on different dates using a technique called interferometry. Figure 29 shows up to -0.47 meter subsidence west and east of Taal Lake.
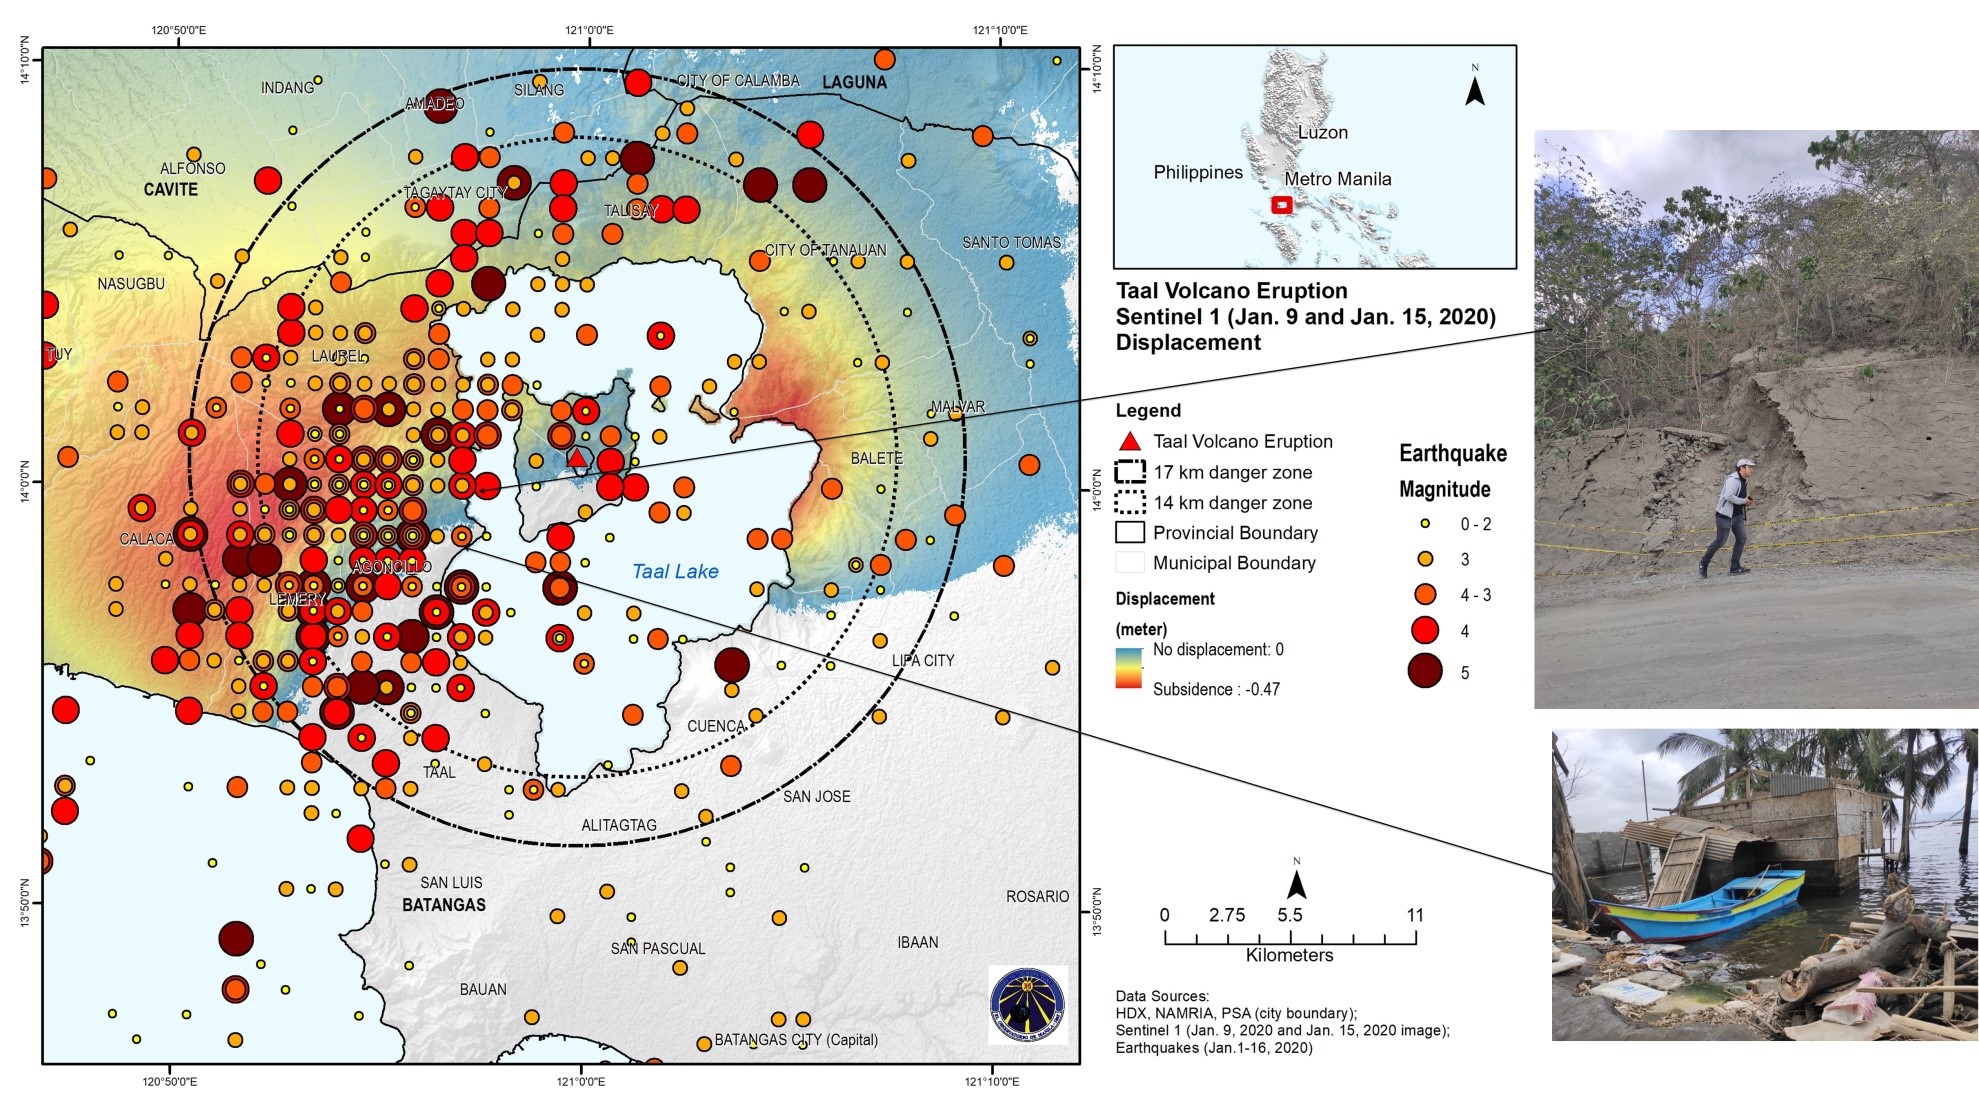
Figure 29. Sentinel 1 (January 9 and 15) Displacement showing ground deformation (subsidence east and west of Taal Lake) and Earthquakes. A picture of a damaged house standing on a piece of land now submerged under water due to subsidence in Agoncillo (photo taken on March 4, 2020), Batangas. Photo of ground fissure along the road in Agoncillo, Batangas (photo taken on March 4, 2020).
Overall Impacts of Taal’s Volcanic Eruption on Infrastructure, Services and Population
6.1 Infrastructure and services
Ashfall from volcanic eruptions and earthquakes damaged houses, blocked roads, interrupted the power and water supply, and halted services. In particular, swarms of earthquakes on the southwest shore of Taal Lake and their resulting fissures damaged thousands of houses, leaving these uninhabitable and families homeless. Furthermore, roads in Batangas and Cavite had to be closed due to thick ashfall [14]. Meanwhile, municipalities in Cavite, Laguna, and Batangas did not have power supply days after the eruption. More than 600 flights had to be canceled because of the ashfall. Classes were also suspended in the affected areas. All of these had significant societal impacts and economic losses. The national government is planning short-term responses to help affected population meet their immediate needs and long-term strategies which include rehabilitation of damaged homes, roads, buildings, and other infrastructures [16].
6.2 Affected Population
As of January 28, 2020, almost 400,000 people have been affected by Taal Volcano’s eruption. This includes persons from affected municipalities, LGUs that accommodated displaced families, and LGUs hosting other LGUs. From 21,945 affected persons on January 14, which covered 25 municipalities from Batangas and Cavite, the number rose to 77,438 persons on January 17. On January 23, the number of affected persons rose to 316,989 covering a wider area, which includes Laguna, Quezon, and NCR areas. Most earthquake epicenters were concentrated on the less-populated municipalities of Agoncillo and Lemery in Batangas (Figure 31). However, these municipalities were likewise affected by ashfall. Until now, some barangays are still trying to recover with aid mostly from NGOs.
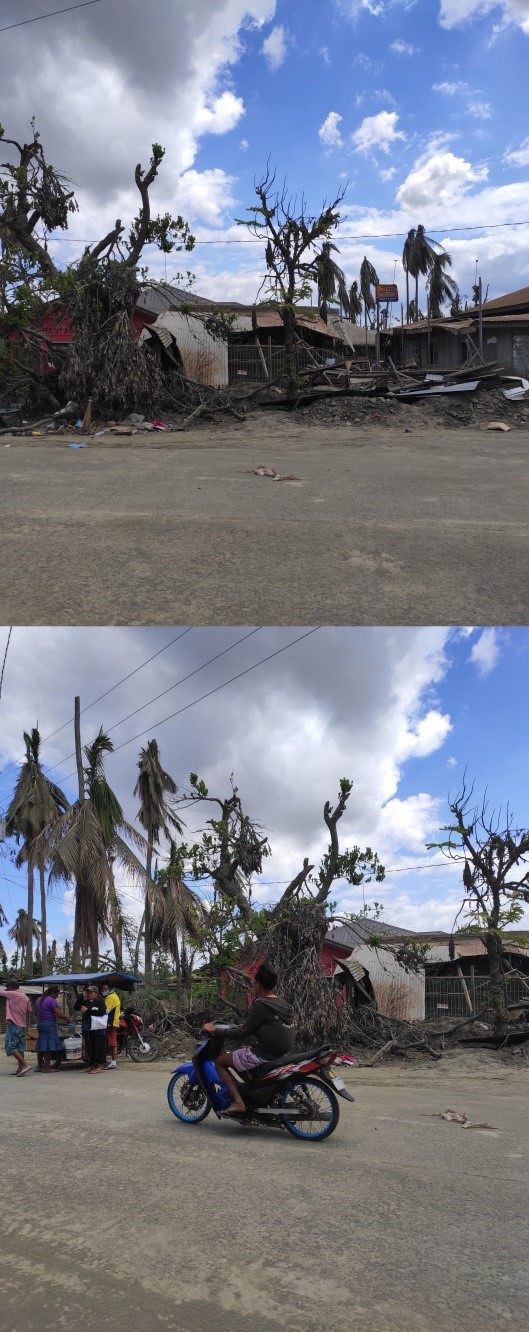
Figure 30. Damaged houses and trees in Banyaga, Agoncillo, Batangas (March 4, 2020).
More evacuation centers are situated in areas with more affected persons but lack of space and sanitation were reported. Figures 31 show the affected population on January 14, 17, 23 and 26, 2020. PHIVOLCS lowered Taal Volcano’s alert status to Level 3 on Sunday, January 26, 2020.
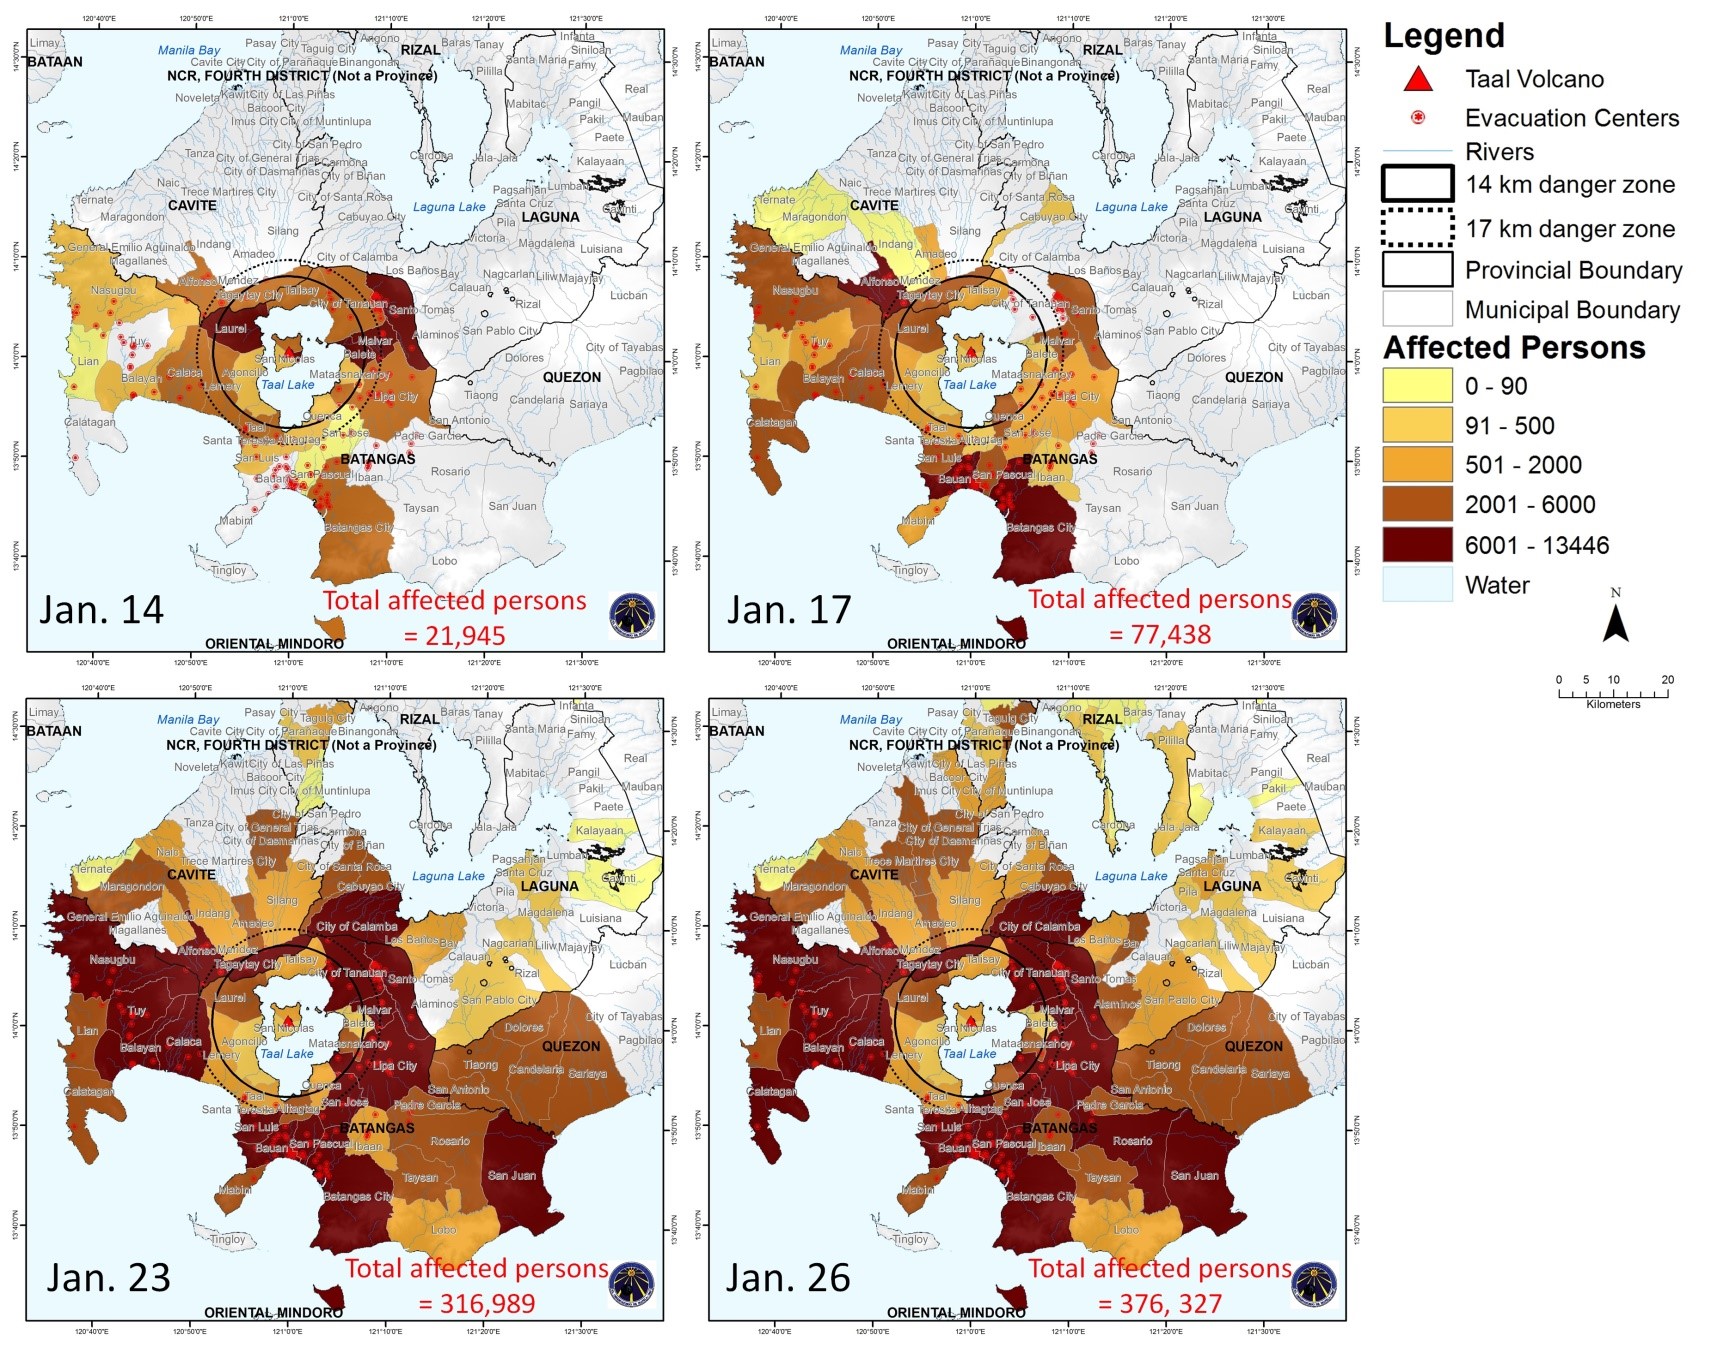
Affected population and location of evacuation centers.
6.3 Affected Vulnerable Population
The elderly, children and people with pre-existing conditions are the most vulnerable to ashfall caused by Taal Volcano because of their weakened immune system [17]. An estimated 21,000 children residing in the 14 km danger zone have been evacuated from their homes. Some are suffering from respiratory diseases such as colds and cough due to volcanic ash, which can worsen because of the cramped evacuation centers [18]. Listed in Table 1 are the number of residents and vulnerable populations within the 14km danger zone.
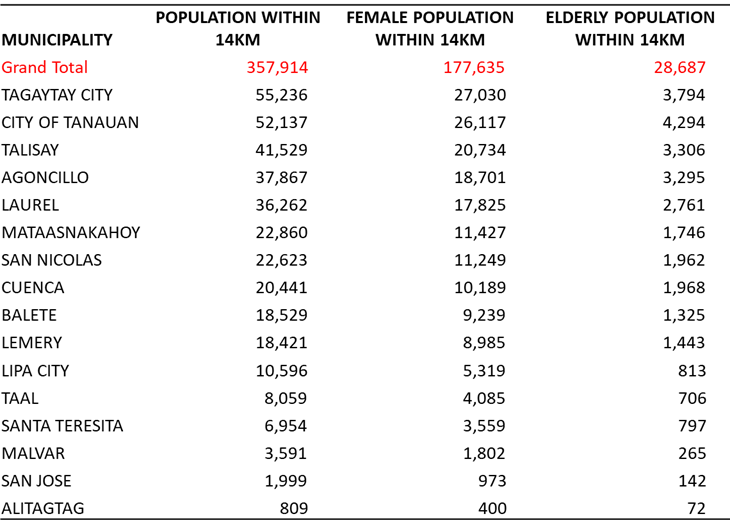
sTable 1. Estimated number of residents within 14km danger zone based on 2015 PSA Census data.
Disclaimer
The information in this report are provided as a public service. For official updates and warnings, please refer to PHIVOLCS and other government agencies.
Acknowledgement:
We acknowledge the satellite images from Japan Aerospace Exploration Agency (JAXA) and damaged fish pens GIS layer from Asian Institute of Technology (AIT) obtained through Sentinel Asia. We also acknowledge the help of Asian Disaster Reduction Center (ADRC) for this emergency observation. We also acknowledge SIIS KARI for providing the fine resolution satellite images of KOMPSAT over Laurel, Batangas. We also acknowledge Randell Teodoro for the 1911 maps of Taal Volcano from the Manila Observatory’s Archives. Lastly, we acknowledge the UK Royal Society, British Geological Survey, Global Challenges Research Fund, through Environmental Science Department of Ateneo de Manila University for organizing field visit for the project entitled “Using a multihazard and catchment-based approach to understand and increase resilience in hyper-expanding cities in Viet Nam and the Philippines” in Cavite and Batangas on March 4, 2020.
References:
[1] Ramirez, Rachel. The Philippines volcanic eruption is harming public health, but not the climate —yet https://grist.org/climate/the-philippines-volcanic-eruption-is-harming-public-health-but-not-the-climate-yet/. Jan. 17, 2020 (Accessed January 23, 2020).
[2] Mack, E. (n.d.). Philippines Taal Volcano Spews Ash, Lava And Creates Chaos In World’s 3rd Largest City. Forbes. https://www.forbes.com/sites/ericmack/2020/01/12/a-volcanic-eruption-in-the-philippines-is-creating-chaos-in-the-worlds-3rd-largest-city/(Accessed February 4, 2020).
[3] PHIVOLCS. Taal Volcano Bulletin 27. https://www.phivolcs.dost.gov.ph/index.php/taal-volcano-bulletin-menu/9702-taal-volcano-bulletin-27-january-2020-8-00-a-m. January 27, 2020 (Accessed January 27, 2020).
[4] USGS. Volcanoes can affect the Earth’s Climate. https://volcanoes.usgs.gov/vhp/gas_climate.html. October 23, 2019 (Accessed: January 27, 2020).
[5] USEPA. Sulfur Dioxide (SO2) Pollution. Sulfur Dioxide Basics. https://www.epa.gov/so2-pollution/sulfur-dioxide-basics. No date (Accessed: January 23, 2020).
[6] McGee, Kenneth A., Michael P. Doukas, Richard Kessler, & Terrence M. Gerlach. Impacts of Volcanic Gases on Climate, the Environment and People. U.S. Geological Survey Open-File Report 97-262. https://pubs.usgs.gov/of/1997/of97-262/of97-262.html. May 1997 (Accessed: January 23, 2020).
[7] Amos, Jonathan. Taal volcano’s inner lake all but gone in eruption. https://www.bbc.com/news/science-environment-44661949. Jan. 16, 2020 (Accessed: January 23, 2020).
[8] Lacaux, J.P., Tourre, Y.M., Vignolles, Cecile, Ndione, J.A., and Lafaye, M., 2007, Classification of ponds from high-spatial resolution remote sensing—Application to Rift Valley Fever epidemics in Senegal: Remote Sensing of Environment v. 106, p. 66–74.
[9] De Vera Ruiz, Ellalyn & Genalyn Kabiling. Taal Lake fish kill feared. https://news.mb.com.ph/2020/01/14/taal-lake-fish-kill-feared/. Jan. 14, 2020 (Accessed: January 23, 2020).
[10] Portion of Pansipit River in Taal dries up; Phivolcs explains why. (n.d.). Manila Bulletin News. https://news.mb.com.ph/2020/01/15/portion-of-pansipit-river-in-
taal-dries-up-phivolcs-explains-why (Accessed: January 24, 2020).
[11] ABS-CBN News. (n.d.). Don’t eat fish from Taal Lake, DOH says. Retrieved January 29, 2020, from https://news.abs-cbn.com/business/01/14/20/dont-eat-fish-from-
Taal-lake-doh-says. (Accessed: January 24, 2020).
[12] DA Communications Group. Agri damage from Taal eruption reaches Php3B. http://www.da.gov.ph/agri-damage-from-taal-eruption-reaches-php3b/. January 17, 2020 (Accessed: January 27, 2020).
[13] PHIVOLCS. Introduction to Earthquake. http://phivolcs.dost.gov.ph/index.php/earthquake/introduction-to-earthquake. No date (Accessed: January 27, 2020).
[14] NDRRMC. Situation Report No. 47 re Taal Volcano Eruption. January 28, 2020.
[15] Philippine Statistics Authority. Poverty incidence (PI). https://psa.gov.ph/content/poverty-incidence-pi-0. (Accessed: January 30, 2020).
[16] GMA News Online. Long-term plan for Batangas rehab sought after Taal eruption. https://www.gmanetwork.com/news/news/nation/723655/long-term-plan-for-batangas-rehab-sought-after-taal-eruption/story/. January 28, 2020. (Accessed: January 27, 2020).
[17] ABS-CBN News. Doctor warns of health risks from Taal’s volcanic ash. https://news.abs-cbn.com/news/01/14/20/Doctor-warns-of-health-risks-from-taals-volcanic-ash. Jan. 14, 2020. (Accessed: January 27, 2020).
[18] Save The Children (2020). More than 20,000 children evacuated from the ‘danger zone’ around erupting volcano—Philippines. ReliefWeb. Retrieved January 27, 2020, from https://reliefweb.int/report/philippines/more-20000-children-evacuated-
Danger-zone-around-erupting-volcano. (Accessed: January 27, 2020).
[19] EPA Victoria. 2019. Review of national ambient air quality standards. https://ref.epa.vic.gov.au/your-environment/air/review-of-national-ambient-air-quality-standards (Accessed. February 12, 2020).
[20] Patel, Kasha. 2020. NASA earth observatory. Sulfur Spews from Taal. https://earthobservatory.nasa.gov/images/146142/sulfur-spews-from-taal (Accessed. February 12, 2020).
[21] Maso, Rev. Miguel Saderra. 1911. The Eruption of Taal Volcano: January 30, 1911. Manila, p.7.
[22] Worcester, Dean. 1912. Map of the Region affected by the region’s “Great Eruption” of January 30, 1911.
Map Data Sources:
ESA. 2020. S2A_MSIL2A_20200128T021941_N0213_R003_T51PTR_20200128T053145.
ESA. 2020. S2B_MSIL2A_20200113T022039_N0213_R003_T51PUR_20200113T042911.
ESA. 2020. S2B_MSIL2A_20200123T021959_N0213_R003_T51PTR_20200123T043032.
ESA. 2020. S1B_IW_SLC__1SDV_20200115T214613_20200115T214640_019833_02580A_2888.
ESA. 2020. S1A_IW_SLC__1SDV_20200109T214653_20200109T214720_030729_0385EB_FF3E.
Google. 2020. Consolidated map of evacuation centers.
HDX, NAMRIA, PSA. 2018. Political Boundaries.
JAXA ALOS. 2020. 0000325954_001001_ALOS2304960290-200115.
JAXA ALOS. 2019. 0000325955_001001_ALOS2267183330-190505.
NAMRIA. 2015. Land cover.
NDRRMC. 2020. Taal Situation Report.
Openstreetmap.org. (2020). Waterways and Roads.
PHIVOLCS. 2020. Earthquake Information. https://www.phivolcs.dost.gov.ph/index.php/earthquake/earthquake-information3.
PSA. 2015. Population.
PSA. 2015. Poverty Incidence.
SIIS KARI. 2020. K3A_20200116052240_26556_00373873_L0F.
SIIS KARI. 2019. K3A_20190406051502_22249_00120818_L0F
USGS. 2018. LC08_L1TP_116050_20181203_20181211_01_T1.

